Comparative Study
. 2010 Dec;13(12):1505-10.
doi: 10.1038/nn.2691. Epub 2010 Nov 14.

Extensive spontaneous plasticity of corticospinal projections after primate spinal cord injury

Affiliations
Comparative Study

Extensive spontaneous plasticity of corticospinal projections after primate spinal cord injury

Ephron S Rosenzweig et al. Nat Neurosci. 2010 Dec.

Abstract

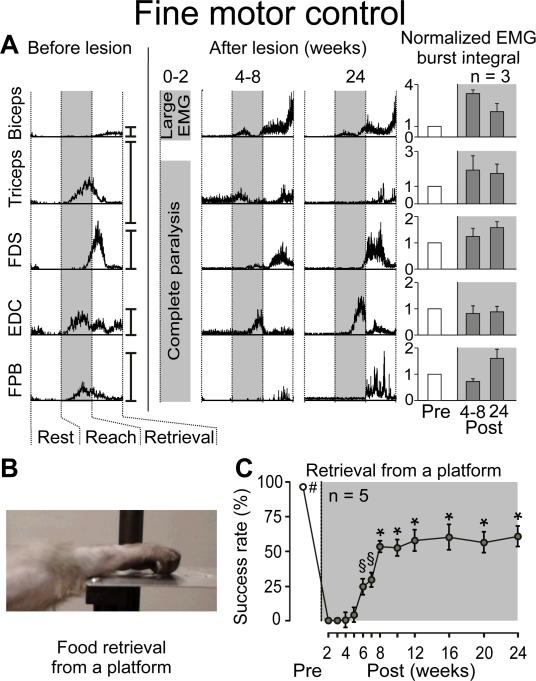
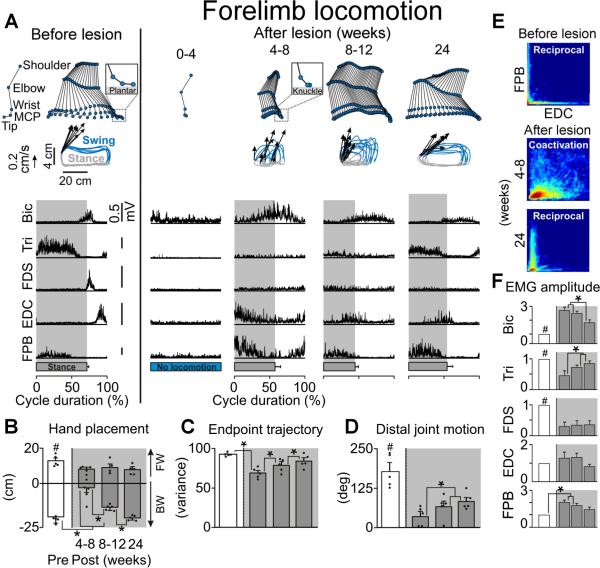
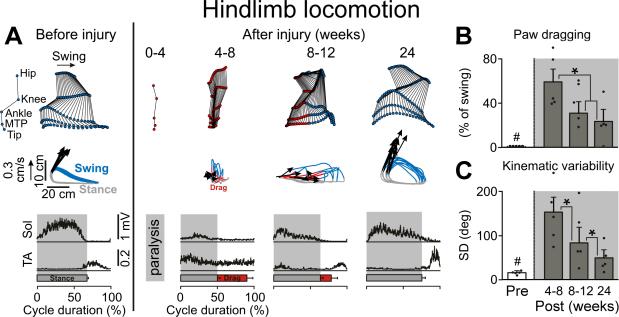
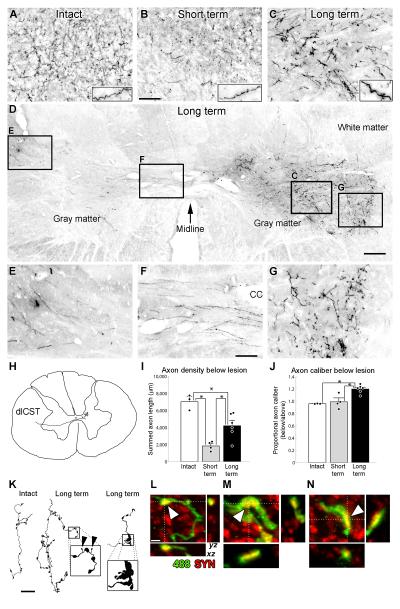
Although axonal regeneration after CNS injury is limited, partial injury is frequently accompanied by extensive functional recovery. To investigate mechanisms underlying spontaneous recovery after incomplete spinal cord injury, we administered C7 spinal cord hemisections to adult rhesus monkeys and analyzed behavioral, electrophysiological and anatomical adaptations. We found marked spontaneous plasticity of corticospinal projections, with reconstitution of fully 60% of pre-lesion axon density arising from sprouting of spinal cord midline-crossing axons. This extensive anatomical recovery was associated with improvement in coordinated muscle recruitment, hand function and locomotion. These findings identify what may be the most extensive natural recovery of mammalian axonal projections after nervous system injury observed to date, highlighting an important role for primate models in translational disease research.


Figures

Figure 1
Figure 1. Spontaneous Improvement in Object Retrieval with the Hand After C7 Lateral Hemisection
A: Representative EMG activity recorded from forelimb muscles during successful retrievals before and after injury (10–15 trials per time point). Traces are normalized with respect to the timing of forelimb motion, i.e., rest, reach and retrieval, as indicated by vertical dotted lines. The reach phase corresponds to the time from the onset of forelimb motion to contact of the hand with the food item. The retrieval phase begins from the end of the reach phase and finishes with contact of the food item to the mouth. Vertical scale bars on the right side of each trace denote 100% of peak muscle activity during locomotion at 1 mph. Time points are shown as a range of weeks to emphasize inter-individual differences in the timing of the recovery. Mean integrated EMG amplitudes (+SEM) for forelimb EMG bursts during successful retrievals are shown. No statistical differences were detected in the amplitude of EMG burst amplitudes between pre- and post-lesion retrievals. B: Fine motor control task. From a standardized starting position, monkeys used their affected arm to retrieve a food item resting on a platform. C: Mean success in hand use reported as a percent of successful food retrieval trials (±SEM) in 5 monkeys. #, §, and * denote conditions that are significantly different (p<0.05) from all time points not marked with the same symbol. FDS, Flexor Digitorum Superficialis; EDC, Extensor Digitorum Communis; FPB, Flexor Pollicis Brevis.
Figure 2
Figure 2. Partial Recovery in Forelimb Use During Locomotion After C7 Hemisection
A: Representative stick diagram decompositions (30 ms between sticks) of the right (lesioned) forelimb motion during the swing phase while stepping quadrupedally on the treadmill at 0.45 m/s before and at different time points post-injury. The successive (n=10 steps), color-coded trajectories of the forelimb endpoint (metacarpo-phalangeal joint, MCP) are shown together with the intensity and direction of the forelimb endpoint velocity (arrows) at swing onset. Mean (n=10 steps) integrated EMG activity of selected forelimb muscles is represented for the different time points. The shaded area indicates the duration of the stance phase. B: Mean (+SEM) values for the posterior (negative direction) and anterior (positive direction) positions reached by the forelimb endpoint (MCP) with respect to the shoulder (horizontal distance) during each gait cycle. Dots represent individual values (n = 5 monkeys). C: Consistency of forelimb endpoint trajectory measured by principal component analysis. Mean (+SEM) values of the amount of variance explained by the first principal component are reported. D: Mean (+SEM) values for the amplitude of distal joint motion measured during each gait cycle. E: Probability density distributions of normalized EMG amplitudes in the flexor pollicis brevis (FPB) and extensor digitorum communis (EDC) during treadmill stepping. L-shape pattern observed during stepping pre-lesion indicates reciprocal activation between the antagonist FPB and EDC motor pools. D-shape during stepping at 4–8 weeks post-lesion indicates co-activation between the FPB and EDC. F: Mean EMG amplitude (+SEM) for forelimb EMG bursts during locomotion (n=3 monkeys). #, significantly different from all other time points at p<0.05; *, significantly different from indicated time points at p<0.05.
Figure 3
Figure 3. Extensive Recovery of Hindlimb Locomotion After C7 Hemisection
A: Representative stick diagram decompositions (30 ms between sticks) of lesion-side hindlimb movements during the swing phase while stepping quadrupedally on the treadmill at 0.45 m/s before and at different time points post-injury. The successive (n = 10 steps), color-coded trajectories (blue, swing; red, drag; grey, stance) of the hindlimb endpoint (MTP) are shown together with the intensity and direction of the hindlimb endpoint velocities (arrows) at swing onset. Mean integrated EMG activity (n = 10 steps) of selected hindlimb muscles (Sol, Soleus; TA, Tibialis Anterior) is shown at the bottom of the panel for each time point. Shaded areas indicate the duration of the stance phase, red bars indicate the duration of paw dragging. B: Mean (+SEM) duration of paw dragging expressed as a percentage of the total swing phase duration at each time point tested. Dots represent individual values (n = 5). C: Mean (+SEM) variability of hip, knee, ankle, and MTP joint movements expressed as the sum of the standard deviation (SD) for each joint over 10 successive gait cycles. #, significantly different from all other time points at p<0.05. *, significantly different from indicated time points at p<0.05.
Figure 4
Figure 4. Extensive Compensatory Plasticity of the Lesioned Corticospinal Tract in Primates
AC: Compensatory sprouting of lesioned, D-A488-labeled corticospinal axons in the intermediate zone of the gray matter caudal to the C7 hemisection. Insets demonstrate increased axon caliber in Long-term subjects, quantified below. D–G: Corticospinal axons in right-side gray matter below the lesion originate from the opposite (left) side of the spinal cord. D: Long-term lesioned subject. Lesion is on right side; arrow denotes midline. Boxed regions are shown at higher magnification. E–G demonstrate the path of corticospinal axons as they (E) exit the left dorsolateral fasciculus, (F) decussate across the spinal cord midline (cc, central canal), and (G) terminate in the lateral motor neuron pools. H: Serial reconstruction of a single axon, demonstrating unequivocally that it originates from the left dorsolateral corticospinal tract. I: Corticospinal axon density was reduced ~75% two weeks after injury, and recovered to more than half of prelesion axon density by 24 weeks post-lesion. J: Quantification of axon thickness. Long-term lesioned animals exhibited a 20% increase in axon caliber below the lesion. There were no significant differences between groups in axon density or caliber above the lesion level, therefore the observed changes were not due to variability in tracer efficacy. In (I) and (J), dots denote individual animals' data points, * indicate p < 0.05. K: Serial reconstructions of axonal arbors in an Intact (left) and lesioned, Long-term (middle and right) subjects. Axons in lesioned, Long-term subjects exhibit: i) high densities of bouton-like swellings (compare left and middle); ii) small, thin processes, ending in swellings much smaller than normal boutons (middle inset, arrowheads); and iii) large, abnormal structures that exhibit morphological features resembling growth cones (right inset). LN: Colocalization (arrowheads) of the synaptic marker synaptophysin (red) with DA488-labeled (green) bouton-like swellings in axons sprouting below the C7 lesion site in the Long-term group: L is a normal-appearing bouton-like swelling, and M, N are examples from atypically large boutons found only in Long-term subjects as shown in panel K. Scale bar A–C, 100 μm; D, 250 μm; E–G, 86 μm; K, 25 μm; L–N, 2 μm. Error bars indicate SEM.
Figure 5
Figure 5. Relationship Between Anatomical Plasticity and Functional Recovery
Principal components analysis in the four Long-term subjects with both functional and anatomical data reveals a multivariate relationship between corticospinal sprouting density and functional recovery. The first principal component (PC1; circle) reflects a data-driven statistical clustering of the histological and functional outcome variables. Positive loading (analogous to a positive Pearson correlation) of variables onto PC1 is indicated in shades of red, and negative loading (analogous to an inverse Pearson correlation) is indicated in shades of blue. The magnitude of the loading is indicated by arrow thickness and below each variable; asterisks indicate statistical significance (|loading| > 0.40). Note that axon density co-loads on PC1 with both locomotor function on a treadmill and success in recovering food rewards from a platform. PC1 accounts for 59.2% of the variability in the data.

References

    1. Fawcett JW, et al. Guidelines for the conduct of clinical trials for spinal cord injury as developed by the ICCP panel: spontaneous recovery after spinal cord injury and statistical power needed for therapeutic clinical trials. Spinal Cord. 2007;45:190–205. - PubMed
    1. Courtine G, et al. Performance of locomotion and foot grasping following a unilateral thoracic corticospinal tract lesion in monkeys (Macaca mulatta) Brain. 2005;128:2338–2358. - PubMed
    1. Little JW, Halar E. Temporal course of motor recovery after Brown-Sequard spinal cord injuries. Paraplegia. 1985;23:39–46. - PubMed
    1. Roth EJ, Park T, Pang T, Yarkony GM, Lee MY. Traumatic cervical Brown-Sequard and Brown-Sequard-plus syndromes: the spectrum of presentations and outcomes. Paraplegia. 1991;29:582–589. - PubMed
    1. Courtine G, et al. Recovery of supraspinal control of stepping via indirect propriospinal relay connections after spinal cord injury. Nat. Med. 2008;14:69–74. - PMC - PubMed

Publication types