Development of a resistance-like phenotype to sorafenib by human hepatocellular carcinoma cells is reversible and can be delayed by metronomic UFT chemotherapy
- PMID: 21076618
- PMCID: PMC2978915
- DOI: 10.1593/neo.10804
Development of a resistance-like phenotype to sorafenib by human hepatocellular carcinoma cells is reversible and can be delayed by metronomic UFT chemotherapy
Abstract
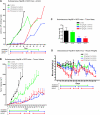
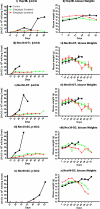
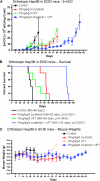
Acquired resistance to antiangiogenic drugs, such as sorafenib, is a major clinical problem. We studied development of a resistance to sorafenib in new preclinical models of human hepatocellular carcinoma (HCC) along with a strategy to delay such resistance--combination with metronomic chemotherapy. Three different xenograft models were studied using human Hep3B HCC cells, which are highly responsive to sorafenib, namely, orthotopic and subcutaneous transplant in severe combined immunodeficient mice, and an orthotopic transplant in nude mice. The complementary DNA for the β-subunit of human choriogonadotropin was transfected into HCC cells, and urine levels of the protein were monitored as a surrogate of tumor burden. Extended daily treatments, sometimes interrupted by a break period of 3 to 7 days to allow recovery from toxicity at sorafenib doses of 30 to 60 mg/kg, were maintained until and after evidence of tumor relapse. Initially responsive tumors seemed to develop a resistance-like phenotype after long-term daily treatment (e.g., >42 days) at doses of 30 to 60 mg/kg. Transplantation of cell lines established from progressing tumors into new hosts showed that the resistant phenotype was not propagated. Furthermore, a regimen of daily metronomic uracil + tegafur (UFT, an oral 5-fluorouracil prodrug) chemotherapy with a less toxic regimen of sorafenib (15 mg/kg per day) significantly delayed the onset of resistance (>91 days). In conclusion, development of a resistance-like phenotype to sorafenib is reversible, and metronomic UFT plus sorafenib may be a promising and well-tolerated treatment for increasing efficacy by delaying emergence of such resistance.
Figures


Similar articles
-
Impact of metronomic UFT/cyclophosphamide chemotherapy and antiangiogenic drug assessed in a new preclinical model of locally advanced orthotopic hepatocellular carcinoma.Neoplasia. 2010 Mar;12(3):264-74. doi: 10.1593/neo.91872. Neoplasia. 2010. PMID: 20234820 Free PMC article.
-
Dynamic contrast-enhanced magnetic resonance imaging biomarkers predict survival and response in hepatocellular carcinoma patients treated with sorafenib and metronomic tegafur/uracil.J Hepatol. 2011 Oct;55(4):858-65. doi: 10.1016/j.jhep.2011.01.032. Epub 2011 Feb 19. J Hepatol. 2011. PMID: 21338641 Clinical Trial.
-
Phase II study of combining sorafenib with metronomic tegafur/uracil for advanced hepatocellular carcinoma.J Hepatol. 2010 Jul;53(1):126-31. doi: 10.1016/j.jhep.2010.01.035. Epub 2010 Mar 30. J Hepatol. 2010. PMID: 20416968 Clinical Trial.
-
Sorafenib: a review of its use in advanced hepatocellular carcinoma.Drugs. 2009;69(2):223-40. doi: 10.2165/00003495-200969020-00006. Drugs. 2009. PMID: 19228077 Review.
-
Sorafenib: in hepatocellular carcinoma.Drugs. 2008;68(2):251-8. doi: 10.2165/00003495-200868020-00007. Drugs. 2008. PMID: 18197728 Review.
Cited by
-
Liver Protective Effects of Renin-Angiotensin System Inhibition Have No Survival Benefits in Hepatocellular Carcinoma Induced By Repetitive Administration of Diethylnitrosamine in Mice.Open Access Maced J Med Sci. 2018 Jun 6;6(6):955-960. doi: 10.3889/oamjms.2018.167. eCollection 2018 Jun 20. Open Access Maced J Med Sci. 2018. PMID: 29983784 Free PMC article.
-
Combination therapy using oral S-1 and targeted agents against human tumor xenografts in nude mice.Exp Ther Med. 2012 May;3(5):755-762. doi: 10.3892/etm.2012.484. Epub 2012 Feb 13. Exp Ther Med. 2012. PMID: 22969964 Free PMC article.
-
Treating hepatocellular carcinoma progression following first-line sorafenib: therapeutic options and clinical observations.Therap Adv Gastroenterol. 2013 Nov;6(6):447-58. doi: 10.1177/1756283X13498540. Therap Adv Gastroenterol. 2013. PMID: 24179481 Free PMC article.
-
Coordinated activation of DNMT3a and TET2 in cancer stem cell-like cells initiates and sustains drug resistance in hepatocellular carcinoma.Cancer Cell Int. 2024 Mar 25;24(1):110. doi: 10.1186/s12935-024-03288-3. Cancer Cell Int. 2024. PMID: 38528605 Free PMC article.
-
Novel antiangiogenic therapies against advanced hepatocellular carcinoma (HCC).Clin Transl Oncol. 2012 Aug;14(8):564-74. doi: 10.1007/s12094-012-0842-y. Epub 2012 Jul 18. Clin Transl Oncol. 2012. PMID: 22855137
References
-
- Rini BI, Atkins MB. Resistance to targeted therapy in renal-cell carcinoma. Lancet Oncol. 2009;10:992–1000. - PubMed
-
- Dudek AZ, Zolnierek J, Dham A, Lindgren BR, Szczylik C. Sequential therapy with sorafenib and sunitinib in renal cell carcinoma. Cancer. 2009;115:61–67. - PubMed
-
- Zimmermann K, Schmittel A, Steiner U, Asemissen AM, Knoedler M, Thiel E, Miller K, Keilholz U. Sunitinib treatment for patients with advanced clear-cell renal-cell carcinoma after progression on sorafenib. Oncology. 2009;76:350–354. - PubMed
Publication types
MeSH terms
Substances
Grants and funding
LinkOut - more resources
Full Text Sources
Other Literature Sources
