

Conditional meta-analysis stratifying on detailed HLA genotypes identifies a novel type 1 diabetes locus around TCF19 in the MHC
- PMID: 21076979
- PMCID: PMC3020293
- DOI: 10.1007/s00439-010-0908-2
Conditional meta-analysis stratifying on detailed HLA genotypes identifies a novel type 1 diabetes locus around TCF19 in the MHC
Abstract
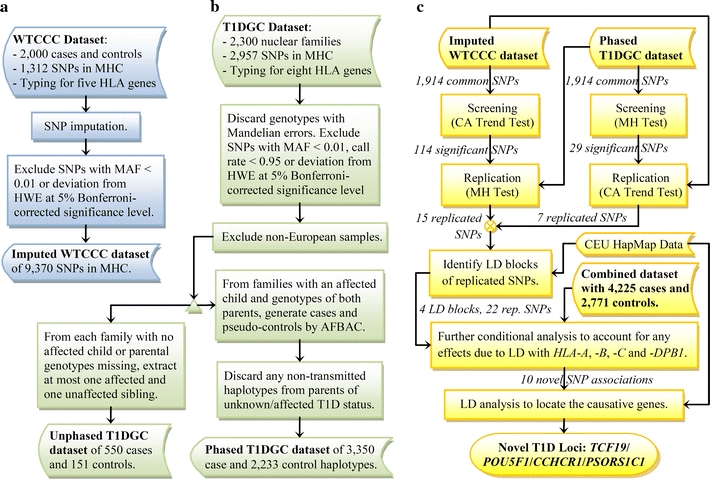
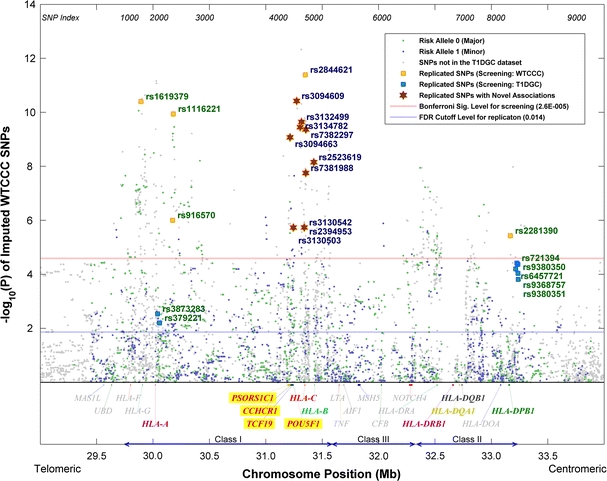
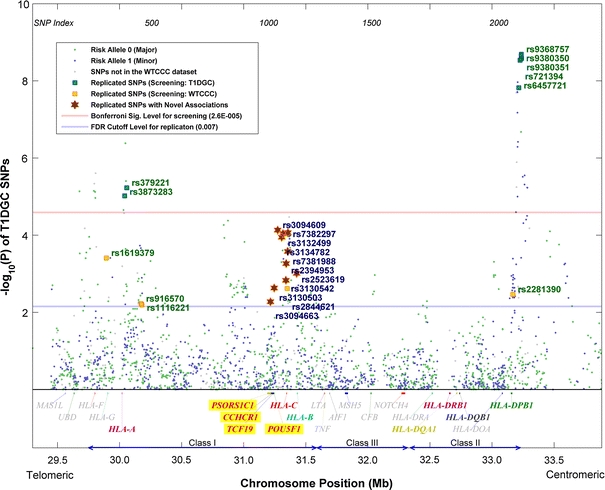
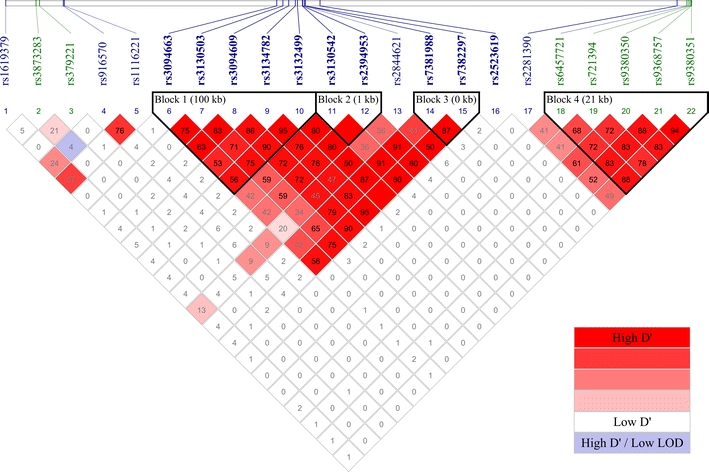
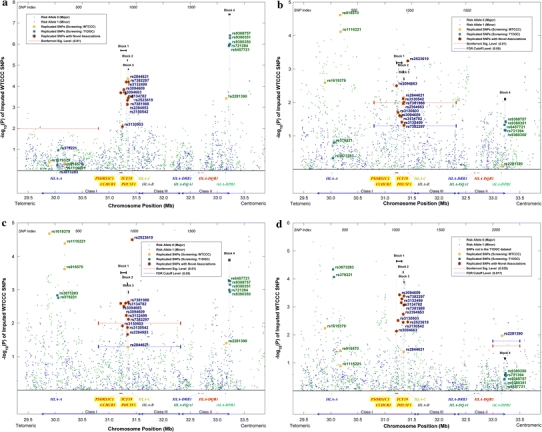
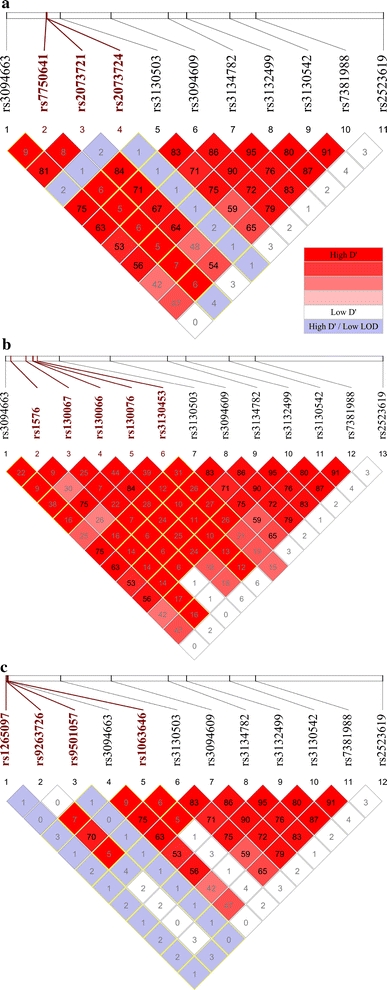
The human leukocyte antigen (HLA) class II genes HLA-DRB1, -DQA1 and -DQB1 are the strongest genetic factors for type 1 diabetes (T1D). Additional loci in the major histocompatibility complex (MHC) are difficult to identify due to the region's high gene density and complex linkage disequilibrium (LD). To facilitate the association analysis, two novel algorithms were implemented in this study: one for phasing the multi-allelic HLA genotypes in trio families, and one for partitioning the HLA strata in conditional testing. Screening and replication were performed on two large and independent datasets: the Wellcome Trust Case-Control Consortium (WTCCC) dataset of 2,000 cases and 1,504 controls, and the T1D Genetics Consortium (T1DGC) dataset of 2,300 nuclear families. After imputation, the two datasets have 1,941 common SNPs in the MHC, of which 22 were successfully tested and replicated based on the statistical testing stratifying on the detailed DRB1 and DQB1 genotypes. Further conditional tests using the combined dataset confirmed eight novel SNP associations around 31.3 Mb on chromosome 6 (rs3094663, p = 1.66 × 10(-11) and rs2523619, p = 2.77 × 10(-10) conditional on the DR/DQ genotypes). A subsequent LD analysis established TCF19, POU5F1, CCHCR1 and PSORS1C1 as potential causal genes for the observed association.
Figures
References
-
- Aly TA, Baschal EE, Jahromi MM, Fernando MS, Babu SR, Fingerlin TE, Kretowski A, Erlich HA, Fain PR, Rewers MJ, Eisenbarth GS. Analysis of single nucleotide polymorphisms identifies major type 1A diabetes locus telomeric of the major histocompatibility complex. Diabetes. 2008;57:770–776. doi: 10.2337/db07-0900. - DOI - PubMed
-
- Armitage P. Tests for linear trends in proportions and frequencies. Biometrics. 1955;11:375–386. doi: 10.2307/3001775. - DOI
-
- Asumalahti K, Veal C, Laitinen T, Suomela S, Allen M, Elomaa O, Moser M, de Cid R, Ripatti S, Vorechovsky I, Marcusson JA, Nakagawa H, Lazaro C, Estivill X, Capon F, Novelli G, Saarialho-Kere U, Barker J, Trembath R, Kere J. Coding haplotype analysis supports HCR as the putative susceptibility gene for psoriasis at the MHC PSORS1 locus. Hum Mol Genet. 2002;11:589–597. doi: 10.1093/hmg/11.5.589. - DOI - PubMed
Publication types
MeSH terms
Substances
Grants and funding
LinkOut - more resources
Full Text Sources
Medical
Molecular Biology Databases
Research Materials
Miscellaneous
