. 2010 Dec;2(12):3455-60.
doi: 10.1021/am1005139. Epub 2010 Nov 15.

Highly sensitive and selective dynamic light-scattering assay for TNT detection using p-ATP attached gold nanoparticle

Affiliations

Highly sensitive and selective dynamic light-scattering assay for TNT detection using p-ATP attached gold nanoparticle

Samuel S R Dasary et al. ACS Appl Mater Interfaces. 2010 Dec.

Abstract

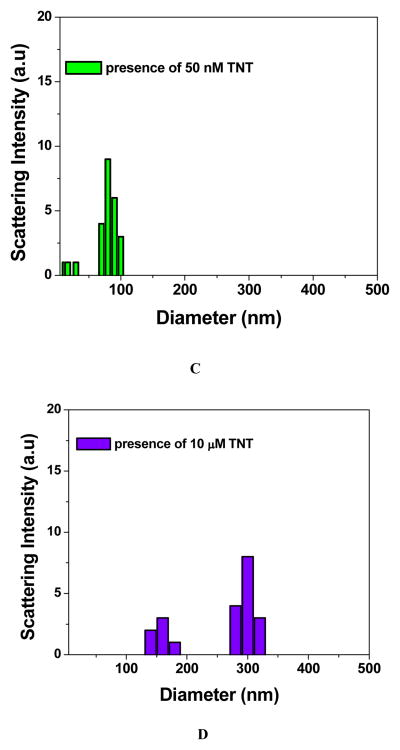
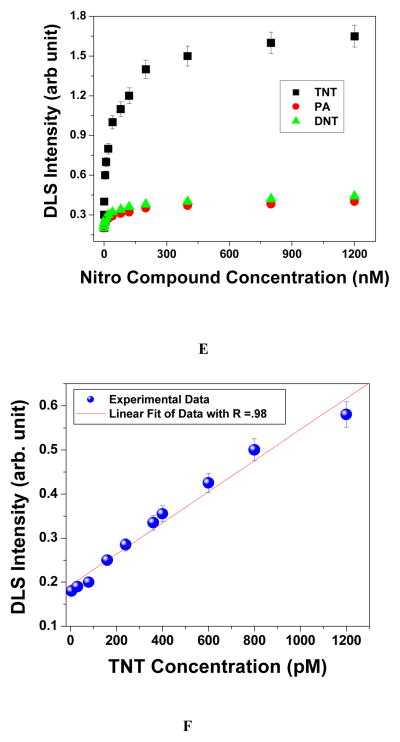
TNT is one of the most commonly used nitro aromatic explosives for landmines of military and terrorist activities. As a result, there is an urgent need for rapid and reliable methods for the detection of trace amount of TNT for screenings in airport, analysis of forensic samples, and environmental analysis. Driven by the need to detect trace amounts of TNT from environmental samples, this article demonstrates a label-free, highly selective, and ultrasensitive para-aminothiophenol (p-ATP) modified gold nanoparticle based dynamic light scattering (DLS) probe for TNT recognition in 100 pico molar (pM) level from ethanol:acetonitile mixture solution. Because of the formation of strong π-donor-acceptor interaction between TNT and p-ATP, para-aminothiophenol attached gold nanoparticles undergo aggregation in the presence of TNT, which changes the DLS intensity tremendously. A detailed mechanism for significant DLS intensity change has been discussed. Our experimental results show that TNT can be detected quickly and accurately without any dye tagging in 100 pM level with excellent discrimination against other nitro compounds.


Figures

Figure 1
Figure 1
A) Photograph showing colorimetric image of p-ATP conjugated gold nanoparticle in the presence of A1) without anything, A2) 0.3 mM 2,4 di-nitro toluene (DNT), A3) 0.3 mM nitro-phenol (NP), A4) 0.3 mM picric acid (PA), A5) 150 μM TNT. B) The absorption spectral changes of p-ATP modified gold nanoparticle in the presence of TNT. Absorption spectra remain the same in the presence of DNT, NP or PA. C) TEM image of p-ATP modified gold nanoparticle in the absence of TNT and D) TEM image of p-ATP modified gold nanoparticle in the presence of TNT.
Figure 2
Figure 2
A) Photograph showing colorimetric change upon the addition of different concentrations of TNT on ATP modified gold nanoparticle: A1) 1 nM TNT, A2) 100 nM TNT, A3) 500 nM TNT, A4) 1 μM TNT, A5) 50 μM TNT, A6) 100 μM TNT, A7) presence of 250 μM TNT. Our data clearly demonstrate that the sensitivity of colorimetric assay is around 50 μM. B) The plot demonstrates the absorption spectral changes of ATP modified gold nanoparticle in the presence of different concentrations of TNT. C) TEM images showing how gold nanoparticle aggregate sizes vary with the concentration of TNT. C1) 5 nM TNT, C2) 100 nM TNT, C3) 50 μM TNT, C4) 500 μM TNT.
Figure 3
Figure 3
Size distributions of p-ATP attached gold nanoparticles measured by DLS, A) in the absence of TNT, B) in the presence of 500 pM TNT, c) in the presence of 15 nM TNT, D) in the presence of 300 nM TNT. E) Plot demonstrating how DLS intensity varies with TNT/PA/DNT concentration from 1 pM to 1200 nM; F) Plot demonstrating how DLS intensity varies with TNT concentration from 1 pM to 1200 pM.
Figure 3
Figure 3
Size distributions of p-ATP attached gold nanoparticles measured by DLS, A) in the absence of TNT, B) in the presence of 500 pM TNT, c) in the presence of 15 nM TNT, D) in the presence of 300 nM TNT. E) Plot demonstrating how DLS intensity varies with TNT/PA/DNT concentration from 1 pM to 1200 nM; F) Plot demonstrating how DLS intensity varies with TNT concentration from 1 pM to 1200 pM.
Scheme 1
Scheme 1
Schematic representation of p-ATP conjugated gold nanoparticle based TNT detection. A) Shematic representation showing p-ATP modification process. B) Schematic representation showing P-ATP modified gold nanoparticle aggregation in the presence of TNT.

References

    1. Lubin AA, Plaxco KW. Acc Chem Res. 2010;43:496–505. - PMC - PubMed
    1. Smith KD, McCord BR, MacCrehan WA, Mount K, Rowe WF. J Forensic Sci. 1999;44:789–794.
    1. Thomas SW, III, Joly GD, Swager TM. Chem Rev. 2007;107:1339–1386. - PubMed
    1. Dillewijn PV, Couselo JL, Corredoira E, Delgado A, Wittich RM, Ballester A, Ramos JL. Environ Sci Technol. 2008;42:7405–7410. - PubMed
    1. Brettell TA, Butler JM, Almirall JR. Anal Chem. 2007;79:4365–4384. - PubMed

Publication types

MeSH terms