. 2010 Nov 15:11:633.
doi: 10.1186/1471-2164-11-633.

The human G93A-SOD1 mutation in a pre-symptomatic rat model of amyotrophic lateral sclerosis increases the vulnerability to a mild spinal cord compression

Affiliations

The human G93A-SOD1 mutation in a pre-symptomatic rat model of amyotrophic lateral sclerosis increases the vulnerability to a mild spinal cord compression

Natasa Jokic et al. BMC Genomics. .

Abstract

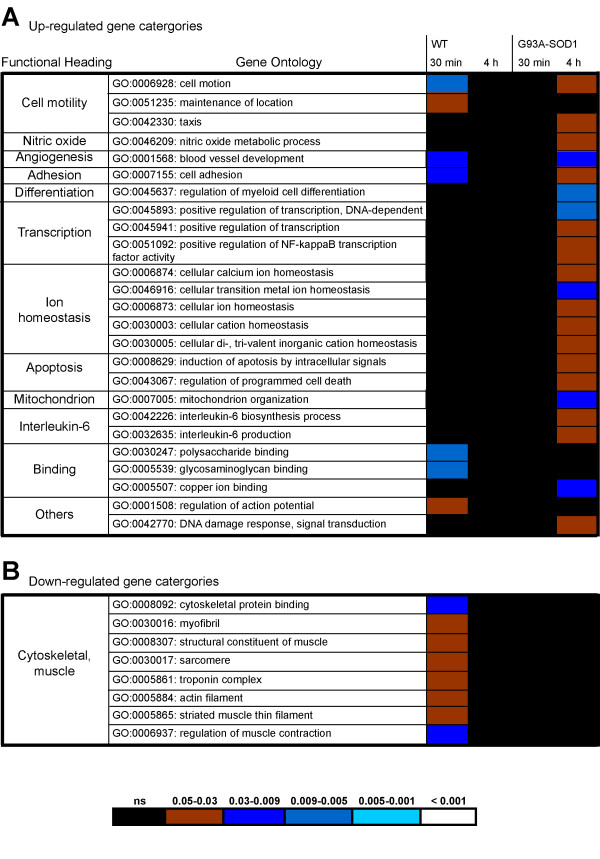
Background: Traumatic injuries can undermine neurological functions and act as risk factors for the development of irreversible and fatal neurodegenerative disorders like amyotrophic lateral sclerosis (ALS). In this study, we have investigated how a mutation of the superoxide dismutase 1 (SOD1) gene, linked to the development of ALS, modifies the acute response to a gentle mechanical compression of the spinal cord. In a 7-day post-injury time period, we have performed a comparative ontological analysis of the gene expression profiles of injured spinal cords obtained from pre-symptomatic rats over-expressing the G93A-SOD1 gene mutation and from wild type (WT) littermates.

Results: The steady post-injury functional recovery observed in WT rats was accompanied by the early activation at the epicenter of injury of several growth-promoting signals and by the down-regulation of intermediate neurofilaments and of genes involved in the regulation of ion currents at the 7 day post-injury time point. The poor functional recovery observed in G93A-SOD1 transgenic animals was accompanied by the induction of fewer pro-survival signals, by an early activation of inflammatory markers, of several pro-apoptotic genes involved in cytochrome-C release and by the persistent up-regulation of the heavy neurofilament subunits and of genes involved in membrane excitability. These molecular changes occurred along with a pronounced atrophy of spinal cord motor neurones in the G93A-SOD1 rats compared to WT littermates after compression injury.

Conclusions: In an experimental paradigm of mild mechanical trauma which causes no major tissue damage, the G93A-SOD1 gene mutation alters the balance between pro-apoptotic and pro-survival molecular signals in the spinal cord tissue from the pre-symptomatic rat, leading to a premature activation of molecular pathways implicated in the natural development of ALS.


Figures

Figure 1
Figure 1
Temporal pattern of recovery of locomotor functions after mild compression SCI in the G93A-SOD1 rats and in the WT littermates. WT animals show a marked functional recovery between 1 and 2 days, followed by a steady locomotor improvement for the remaining period of observation. WT rats display an improved motor function compared to G93A-SOD1 rats from day 2 to day 7 of the post-injury experimental period (the difference between the WT and G93A-SOD1 locomotor functions is statistically significant only from the day 3, * P < 0.05), whereas G93A-SOD1 rats only appeared to perform slightly better, but non-significantly than the WT littermates at 4 hours and at 1 day post-injury. BBB scoring prior to injury of the G93A-SOD1 and the WT rats showed no locomotor dysfunction and no differences in BBB functional scores between the two genetic types (BBB score >21; normal locomotor functions). Error bars represent SEM. N: 5 animals per group were used.
Figure 2
Figure 2
Number of differentially regulated genes at the site of compression spinal cord injury in the G93A-SOD1 rats and in the WT littermates. A. Graph displaying the total number of differentially regulated genes in the 10 week old WT and G93A-SOD1 spinal cord samples at the site of compression SCI. The largest difference in the number of differentially expressed gene candidates between the WT and the G93A-SOD1 spinal cord tissues is seen at the 7-day post-injury time point. B. Break-down of up-regulated versus down-regulated genes in the WT and G93A-SOD1 spinal cords at different time points from compression injury. The most remarkable difference between the two genetic types is the down-regulation of 135 genes in WT injured spinal cord tissue at 7 days post-injury, whilst G93A-SOD1 injured tissue down-regulate only 10 genes. Control: naïve and genetically-matched spinal cord samples (from 10 week old pre-symptomatic rats) were used as reference tissues in the differential gene expression analysis. Five animals per a group were used.
Figure 3
Figure 3
Comparative gene expression analysis by High-Throughput GoMiner of spinal cord samples from G93A-SOD1 and WT rats subjected to a mild compression SCI. The heat chart displays the Gene ontology (GO) categories (grouped into main functional headings) computed by High Throughput GoMiner computational analysis of the differentially expressed genes identified in spinal cord from WT and G93A-SOD1 rats after compression SCI, using naive (10 week old) spinal cord tissue from rats of the same genetic type as reference. High Throughput GoMiner defines the biological significance of the gene expression changes according to a multilayered process of statistical processing. GO categories are selected on the basis of their high level of enrichment of the differentially expressed genes, using a false discovery rate correction (FDR) cut off of <0.05. FDR introduces a multiple comparisons correction, allowing the exclusion of those gene categories that would appear enriched simply by chance. Functionally similar GO categories are grouped within the same heading and reported as up-regulated predominantly in G93A-SOD1 spinal cord (A, ↑G93A-SOD1), in WT spinal cord (B. ↑WT), down-regulated in G93A-SOD1 spinal cord (C. ↓G93A-SOD1) and in WT spinal cord (D. ↓WT). The various levels of significance of differential regulation for each gene category are represented in the heat-chart with different colour codes (the correlation between colour codes and FDR values is reported at the bottom of the heat-chart). G93A-SOD1/WT column: Comparison between the gene expression profiles of spinal cord samples from G93A-SOD1 and WT naïve rats (10 week of age).
Figure 4
Figure 4
Differential regulation in injured spinal cord tissue from WT and G93A-SOD1 rats of the intermediate neurofilament heavy chain and of genes involved in retinol metabolism according to Bead-array analysis. A. Profile of post-injury differential expression of the neurofilament heavy chain (Nfh) in the WT and in the G93A-SOD1 spinal cords (intermediate neurofilaments gene category, GO:0045104), according to the Bead-array gene expression analysis. Note the higher level of expression of the neurofilament in G93A-SOD1 spinal cord at all the post-injury time points and its significant level of down-regulation in WT spinal cord at 7 days from injury compared to naive tissue. B. The graph reports the 7 day post-injury up-regulation in WT and G93A-SOD1 injured spinal cord of genes included in the retinol metabolism gene category (GO:0042572), including retinol binding protein 1 (RBP1) and cellular retinoic acid binding protein 2 (CRABP2). The up-regulation is expressed as the ratio of intensities between injured and naive tissues. Two additional genes within the GO:0042572 gene category, the alcohol dehydrogenase 1 (ADH1) and aldehyde dehydrogenase 1, member A2 (ALDH1a2) are up-regulated only in the G93A-SOD1 spinal cord at 7 days from injury.
Figure 5
Figure 5
High throughput GoMiner ontological analysis of the differentially regulated genes in WT and G93A-SOD1 spinal cord at 30 minutes and 4 hours after laminectomy. The heat chart displays headings containing clusters of functionally related Gene ontology (GO) categories, computed using High Throughput GoMiner. Those gene categories found to be up-regulated in WT and G93A-SOD1 spinal cord tissue after laminectomy compared to naive and genetically matched spinal cord tissues are displayed in Figure 5A, whilst the gene categories which become down-regulated are reported in Figure 5B. At 4 hours from laminectomy, a large number of gene categories are over-expressed only in G93A-SOD1 spinal cord. At the 30 minutes time point, WT spinal cord gene expression differs from G93A-SOD1 tissue for the down-regulation of a number of cytoskeletal gene categories. 10 week old genetically age-matched spinal cord tissues were used as reference. Other: categories which include genes involved in the regulation of the action potential, of the DNA damage response and of signal transduction.
Figure 6
Figure 6
Gene candidates showing a significant differential regulation comparing the G93A-SOD1 to the WT spinal cord after mild compression SCI. 31 gene candidates have been found to have a significant level of differential expression comparing G93A-SOD1 and WT naïve spinal cord tissues at 10 weeks of age (*) and the same tissues at different time points after mild compression SCI (Bead-array analysis). Each gene's differential regulation is further characterised by comparing the injured spinal cord tissue with genetically-matched naive spinal cord tissue and reported as fold changes of the ratio injured/naïve tissues. The genes are sub-divided according to whether their expression change occurs in WT spinal cord, in G93A-SOD1 spinal cord or in both (genes reported in bold) and to whether their expression increases (↑) or decreases (↓) compared to naïve genetically-matched spinal cord tissues. The majority of genes showing differential expression after SCI are identified in the 24 hours and in the 7 days time points. Mapb1, Hcn2 and Mast1 (reported in bold) are differentially regulated in both WT and G93A-SOD1 spinal cords and the differential regulation seems to go in the opposite way for each gene candidate in the two tissues in study when genetically age-matched naive tissue is used as reference. The GO categories which include the differentially regulated genes are also reported (in bold those already identified by GoMiner ontological analysis, Figure 2). *: Nfh expression appears to decrease significantly in the WT spinal cord at 24 hours and 7 days from compression SCI, compared to age-matched and genetically-matched naïve spinal cord.
Figure 7
Figure 7
Histogram representing the G93A-SOD1 versus WT ratios of the spinal cord intensity values detected for Nfh, Map1b, S100A8, Timp2 and Hcn2 at 24 hours and at 7 days from compression injury, as measured by Bead-array and real-time RT-PCR analysis. The G93A-SOD1 vs WT expression ratios obtained using Bead-array (red code) and real time RT-PCR (blue code) analyses for Nfh, Map1b, S100A8, Timp2 and Hcn2 at two time points after compression SCI are reported. The two techniques of gene expression analysis confirm independently the same type of differential regulation for the selected gene candidates. S100A8 real-time RT-PCR confirms both the significant up-regulation in the G93A-SOD1 spinal cord detected by Bead-array analysis 7 days from compression SCI. Map1b RT-PCR has been included in order to validate the sensitivity of the real time RT-PCR and Bead array analyses for expression changes close to two-folds.
Figure 8
Figure 8
Expression of neurofilament heavy chain and synaptophysin in ventral spinal cord at 24 hours after compression SCI. Neurofilament heavy chain (Nfh; clone N52) staining of spinal cord sections is clearly visible in motor neurons (arrows) and adjacent axons in both WT (A) and G93A-SOD1 (B) which is significantly stronger in the G93A-SOD1 (* P = 0.03; E). Scale bar = 100 μm. Transverse sections are taken within a segment 10 mm caudal to the injury epicenter. Synaptophysin (SYN) immunoreactive synaptic boutons (arrows) can be seen surrounding unstained motor neuron cell bodies in both WT (C) and G93A-SOD1 (D) spinal cord, with no difference in SYN distribution between the two genetic types. The intensity of staining is non-significantly different between the G93A-SOD1 and wild type spinal cords (F). Scale bar = 25 μm. SCI-SOD1: spinal cord tissue from rats over-expressing the G93A-SOD1 gene mutation. SCI-WT: spinal cord tissue from WT rats. Western blot of spinal cord rostral to the injury epicenter obtained from WT and G93A-SOD1 rats. Three spinal cord samples for both WT and G93A-SOD1 were used (G). A significant increase in Nfh (clone 52) expression levels can be detected in G93A-SOD1 rats compared to WT rats with β-actin as the internal control (* P = 0.041; H).
Figure 9
Figure 9
Spared white matter in spinal cord caudal to compression epicenter. Spared white matter stained with luxol fast blue can be seen clearly in WT (A) and G93A-SOD1 (B) in sections caudal to the compression epicenter 7 days after compression SCI. Morphometric analysis of the cross sectional areas of luxol fast blue stained white matter in WT and G93A-SOD1 showed no significant difference between groups (P = 0.30, C). ns = non-significant. Scale bar = 200 μm.
Figure 10
Figure 10
Immunoresponse in spinal cord caudal to compression epicenter. ED1 immunopositive cells (macrophages) were detected in the spinal cord ventral horn of WT (A) and G93A-SOD1 (B) in sections caudal to compression epicenter 7 days post-injury. Quantification showed an elevated but non-significant increase in ED1 immunopositive cells in G93A-SOD1 compared to WT spinal cord (P = 0.08, C). OX42 immunopositive cells (activated microglia) were detected in the spinal cord ventral horn of WT (D) and G93A-SOD1 (E) in sections caudal to compression epicenter 7 days post-injury. Quantification showed no significant difference in OX42 immunopositive cells in spinal cord of both groups (P = 0.76, F). ns: non-significant. Scale bar = 200 μm.
Figure 11
Figure 11
Changes affecting astrocytes and motor neurones in spinal cord caudal to the compression epicentre. GFAP immunopositive cells (astrocytes) were detected in the spinal cord ventral horns of the WT (A) and of the G93A-SOD1 (D) rats, in sections caudal to the compression epicenter 7 days post-injury. Quantification showed an elevated but non-significant increase in GFAP immunopositive cells in the G93A-SOD1 compared to the WT spinal cord (P = 0.31, G). Large Nissl stained cells (motor neurones) were detected in the spinal cord ventral horn of WT (B-C) and of G93A-SOD1 (E-F) in sections caudal to the compression epicenter 7 days post-injury. Although the number of motor neurones in the ventral horns are not significantly different between the two groups, further analysis of the motor cells soma size showed that the motor neurones in the WT spinal cord were larger than those identified in the G93A-SOD1 spinal cord (H-I). Kolmogorov-Smirnov test revealed a significant leftward shift in motor neurone soma size of the G93A-SOD1 spinal cord compared to WT spinal cord (P < 0.05, I). ns: non-significant. Scale bar = 200 μm.

Similar articles

Cited by

References

    1. Rosen DR, Siddique T, Patterson D, Figlewicz DA, Sapp P, Hentati A, Donaldson D, Goto J, O'Regan JP, Deng HX. Mutations in Cu/Zn superoxide dismutase gene are associated with familial amyotrophic lateral sclerosis. Nature. 1993;362:59–62. doi: 10.1038/362059a0. - DOI - PubMed
    1. Chio A, Benzi G, Dossena M, Mutani R, Mora G. Severely increased risk of amyotrophic lateral sclerosis among Italian professional football players. Brain. 2005;128:472–476. doi: 10.1093/brain/awh373. - DOI - PubMed
    1. Kihira T, Kanno S, Miwa H, Okamoto K, Kondo T. The role of exogenous risk factors in amyotrophic lateral sclerosis in Wakayama, Japan. Amyotroph Lateral Scler. 2007;8:150–156. doi: 10.1080/17482960601179407. - DOI - PubMed
    1. Pasinelli P, Brown RH. Molecular biology of amyotrophic lateral sclerosis: insights from genetics. Nat Rev Neurosci. 2006;7:710–723. doi: 10.1038/nrn1971. - DOI - PubMed
    1. Valenti M, Pontieri FE, Conti F, Altobelli E, Manzoni T, Frati L. Amyotrophic lateral sclerosis and sports: a case-control study. Eur J Neurol. 2005;12:223–225. doi: 10.1111/j.1468-1331.2004.00978.x. - DOI - PubMed

Publication types

MeSH terms