

An improved method for scoring protein-protein interactions using semantic similarity within the gene ontology
- PMID: 21078182
- PMCID: PMC2998529
- DOI: 10.1186/1471-2105-11-562
An improved method for scoring protein-protein interactions using semantic similarity within the gene ontology
Abstract
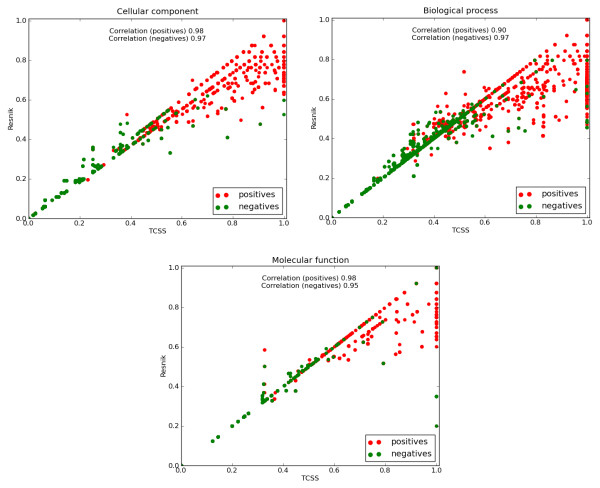
Background: Semantic similarity measures are useful to assess the physiological relevance of protein-protein interactions (PPIs). They quantify similarity between proteins based on their function using annotation systems like the Gene Ontology (GO). Proteins that interact in the cell are likely to be in similar locations or involved in similar biological processes compared to proteins that do not interact. Thus the more semantically similar the gene function annotations are among the interacting proteins, more likely the interaction is physiologically relevant. However, most semantic similarity measures used for PPI confidence assessment do not consider the unequal depth of term hierarchies in different classes of cellular location, molecular function, and biological process ontologies of GO and thus may over-or under-estimate similarity.
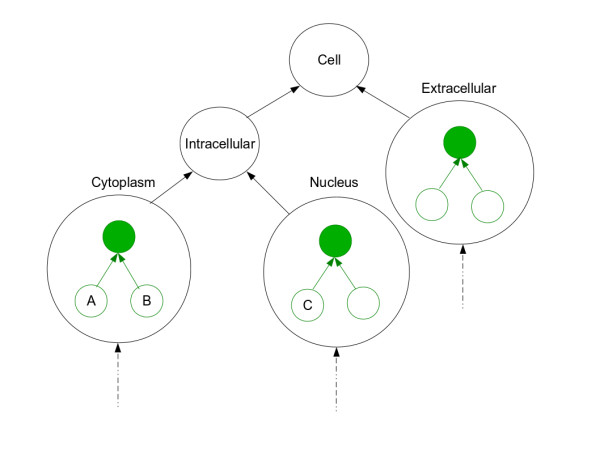
Results: We describe an improved algorithm, Topological Clustering Semantic Similarity (TCSS), to compute semantic similarity between GO terms annotated to proteins in interaction datasets. Our algorithm, considers unequal depth of biological knowledge representation in different branches of the GO graph. The central idea is to divide the GO graph into sub-graphs and score PPIs higher if participating proteins belong to the same sub-graph as compared to if they belong to different sub-graphs.
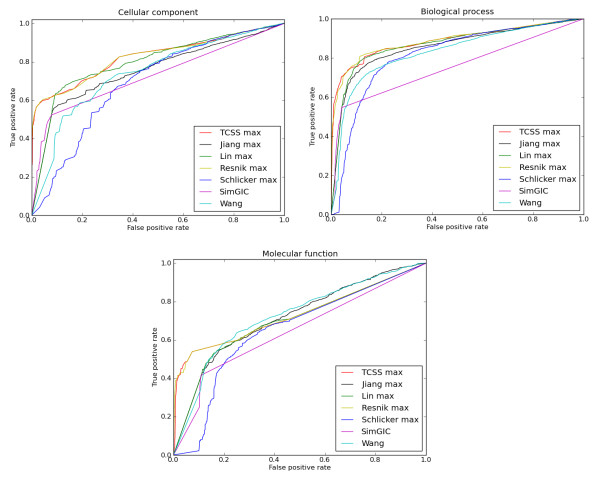
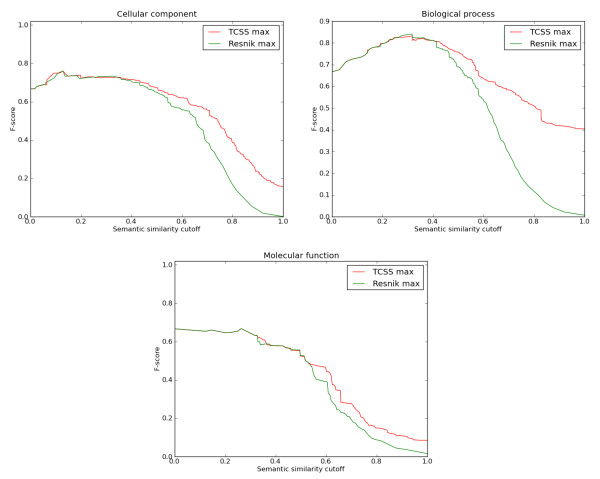
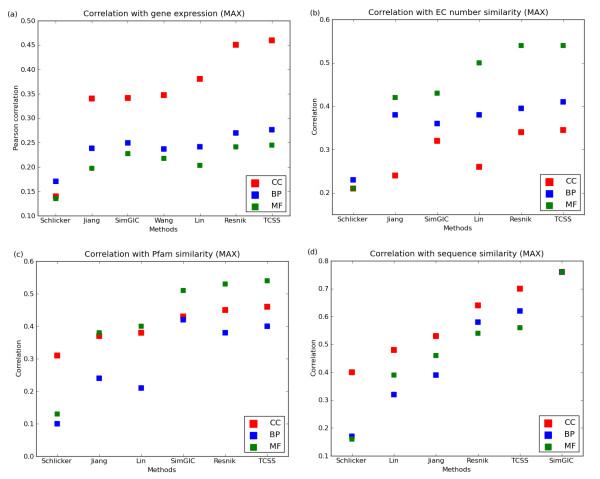
Conclusions: The TCSS algorithm performs better than other semantic similarity measurement techniques that we evaluated in terms of their performance on distinguishing true from false protein interactions, and correlation with gene expression and protein families. We show an average improvement of 4.6 times the F1 score over Resnik, the next best method, on our Saccharomyces cerevisiae PPI dataset and 2 times on our Homo sapiens PPI dataset using cellular component, biological process and molecular function GO annotations.
Figures
References
-
- Ashburner M, Ball CA, Blake JA, Botstein D, Butler H, Cherry JM, Davis AP, Dolinski K, Dwight SS, Eppig JT, Harris MA, Hill DP, Issel-Tarver L, Kasarskis A, Lewis S, Matese JC, Richardson JE, Ringwald M, Rubin GM, Sherlock G. Gene ontology: tool for the unification of biology. The Gene Ontology Consortium. Nat Genet. 2000;25:25–29. - PMC - PubMed
-
- Li D, Liu W, Liu Z, Wang J, Liu Q, Zhu Y, He F. PRINCESS, a protein interaction confidence evaluation system with multiple data sources. Mol Cell Proteomics. 2008;7(6):1043–1052. - PubMed
-
- Rhodes DR, Tomlins SA, Varambally S, Mahavisno V, Barrette T, Kalyana-Sundaram S, Ghosh D, Pandey A, Chinnaiyan AM. Probabilistic model of the human protein-protein interaction network. Nat Biotechnol. 2005;23(8):951–959. - PubMed
-
- Stelzl U, Worm U, Lalowski M, Haenig C, Brembeck FH, Goehler H, Stroedicke M, Zenkner M, Schoenherr A, Koeppen S, Timm J, Mintzlaff S, Abraham C, Bock N, Kietzmann S, Goedde A, Toksoz E, Droege A, Krobitsch S, Korn B, Birchmeier W, Lehrach H, Wanker EE. A human protein-protein interaction network: a resource for annotating the proteome. Cell. 2005;122(6):957–968. - PubMed
Publication types
MeSH terms
Substances
Grants and funding
LinkOut - more resources
Full Text Sources
Molecular Biology Databases
