

Cell death by the quinoxaline dioxide DCQ in human colon cancer cells is enhanced under hypoxia and is independent of p53 and p21
- PMID: 21078189
- PMCID: PMC2993715
- DOI: 10.1186/1748-717X-5-107
Cell death by the quinoxaline dioxide DCQ in human colon cancer cells is enhanced under hypoxia and is independent of p53 and p21
Abstract
Introduction: We have shown that the radio sensitizer DCQ enhances sensitivity of HCT116 human colon cancer cells to hypoxia. However, it is not known whether the p53 or p21 genes influence cellular response to DCQ. In this study, we used HCT116 that are either wildtype for p53 and p21, null for p53 or null for p21 to understand the role of these genes in DCQ toxicity.
Methods: HCT116 cells were exposed to DCQ and incubated under normoxia or hypoxia and the viability, colony forming ability, DNA damage and apoptotic responses of these cells was determined, in addition to the modulation of HIF-1α and of p53, p21, caspase-2, and of the ataxia telangiectasia mutated (ATM) target PIDD-C.
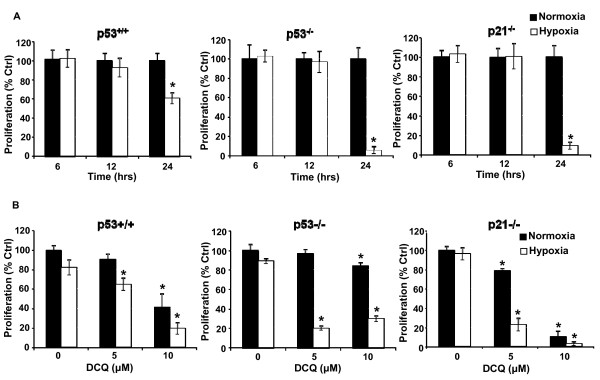
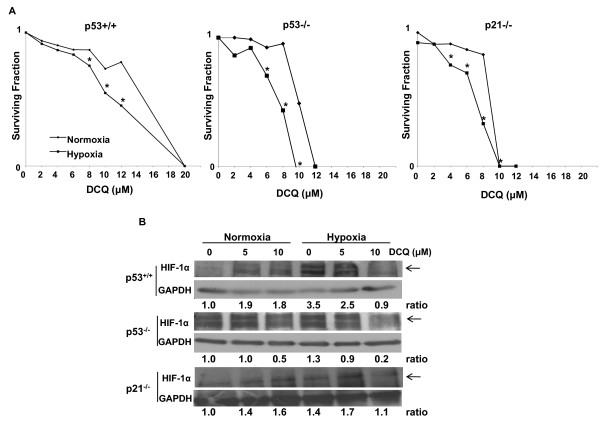
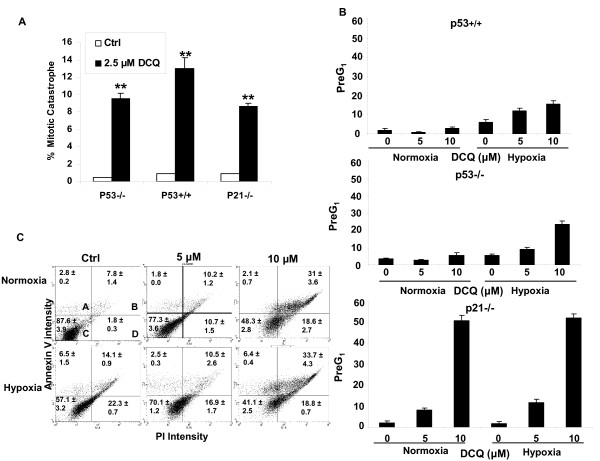
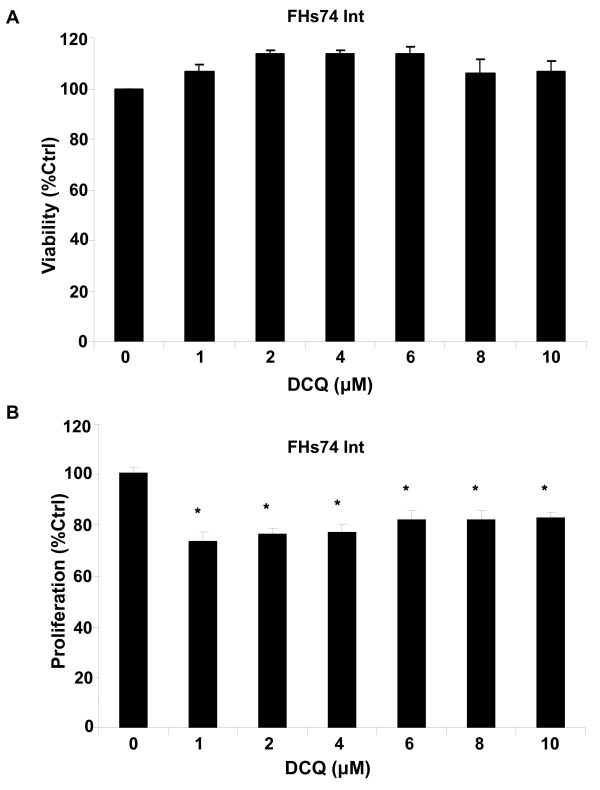
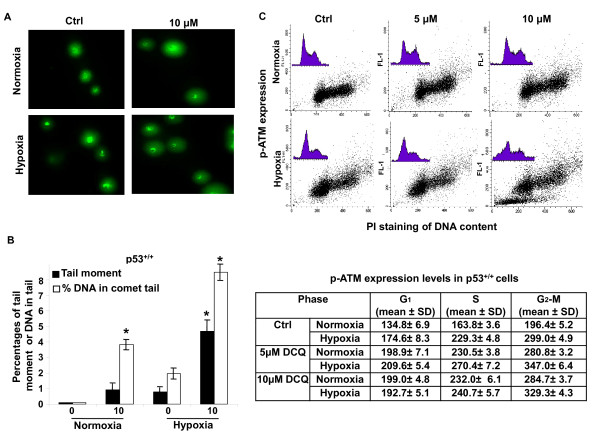
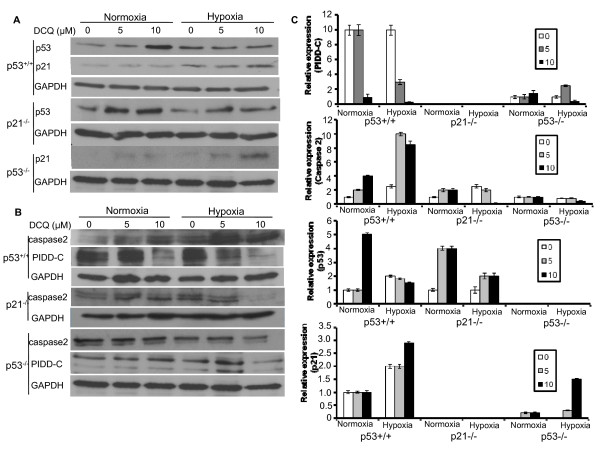
Results: DCQ decreased colony forming ability and viability of all HCT116 cells to a greater extent under hypoxia than normoxia and the p21-/-cell line was most sensitive. Cells had different HIF-1α responses to hypoxia and/or drug treatment. In p53+/+, DCQ significantly inhibited the hypoxia-induced increases in HIF-1α protein, in contrast to the absence of a significant HIF-1α increase or modulation by DCQ in p21-/- cells. In p53-/- cells, 10 μM DCQ significantly reduced HIF-1α expression, especially under hypoxia, despite the constitutive expression of this protein in control cells. Higher DCQ doses induced PreG1-phase increase and apoptosis, however, lower doses caused mitotic catastrophe. In p53+/+ cells, apoptosis correlated with the increased expression of the pro-apoptotic caspase-2 and inhibition of the pro-survival protein PIDD-C. Exposure of p53+/+ cells to DCQ induced single strand breaks and triggered the activation of the nuclear kinase ATM by phosphorylation at Ser-1981 in all cell cycle phases. On the other hand, no drug toxicity to normal FHs74 Int human intestinal cell line was observed.
Conclusions: Collectively, our findings indicate that DCQ reduces the colony survival of HCT116 and induces apoptosis even in cells that are null for p53 or p21, which makes it a molecule of clinical significance, since many resistant colon tumors harbor mutations in p53.
Figures
Similar articles
-
The quinoxaline di-N-oxide DCQ blocks breast cancer metastasis in vitro and in vivo by targeting the hypoxia inducible factor-1 pathway.Mol Cancer. 2014 Jan 24;13:12. doi: 10.1186/1476-4598-13-12. Mol Cancer. 2014. PMID: 24461075 Free PMC article.
-
Radiosensitization by 2-benzoyl-3-phenyl-6,7-dichloroquinoxaline 1,4-dioxide under oxia and hypoxia in human colon cancer cells.Radiat Oncol. 2007 Jan 3;2:1. doi: 10.1186/1748-717X-2-1. Radiat Oncol. 2007. PMID: 17201910 Free PMC article.
-
Modulation of TRAIL-induced tumor cell apoptosis in a hypoxic environment.Cancer Biol Ther. 2005 Oct;4(10):1068-74. doi: 10.4161/cbt.4.10.2255. Epub 2005 Oct 18. Cancer Biol Ther. 2005. PMID: 16294025
-
Reciprocal influence of the p53 and the hypoxic pathways.Cell Death Dis. 2011 May 26;2(5):e164. doi: 10.1038/cddis.2011.48. Cell Death Dis. 2011. PMID: 21614094 Free PMC article. Review.
-
Protective mechanisms of p53-p21-pRb proteins against DNA damage-induced cell death.Cell Cycle. 2008 Feb 1;7(3):277-82. doi: 10.4161/cc.7.3.5328. Epub 2007 Nov 18. Cell Cycle. 2008. PMID: 18235223 Review.
Cited by
-
Sex Differences in Colon Cancer: Genomic and Nongenomic Signalling of Oestrogen.Genes (Basel). 2023 Dec 16;14(12):2225. doi: 10.3390/genes14122225. Genes (Basel). 2023. PMID: 38137047 Free PMC article. Review.
-
Toxic metabolites, MAPK and Nrf2/Keap1 signaling pathways involved in oxidative toxicity in mice liver after chronic exposure to Mequindox.Sci Rep. 2017 Feb 3;7:41854. doi: 10.1038/srep41854. Sci Rep. 2017. PMID: 28157180 Free PMC article.
-
Di(2-ethylhexyl) phthalate inhibits glutathione regeneration and dehydrogenases of the pentose phosphate pathway on human colon carcinoma cells.Cell Stress Chaperones. 2020 Jan;25(1):151-162. doi: 10.1007/s12192-019-01060-5. Epub 2019 Dec 17. Cell Stress Chaperones. 2020. PMID: 31848848 Free PMC article.
-
Quinoxaline 1,4-Dioxides: Advances in Chemistry and Chemotherapeutic Drug Development.Pharmaceuticals (Basel). 2023 Aug 17;16(8):1174. doi: 10.3390/ph16081174. Pharmaceuticals (Basel). 2023. PMID: 37631089 Free PMC article. Review.
-
GPER mediates differential effects of estrogen on colon cancer cell proliferation and migration under normoxic and hypoxic conditions.Oncotarget. 2017 Sep 6;8(48):84258-84275. doi: 10.18632/oncotarget.20653. eCollection 2017 Oct 13. Oncotarget. 2017. PMID: 29137421 Free PMC article.
References
Publication types
MeSH terms
Substances
LinkOut - more resources
Full Text Sources
Molecular Biology Databases
Research Materials
Miscellaneous
