. 2011 Feb;187(2):441-54.
doi: 10.1534/genetics.110.123372. Epub 2010 Nov 15.

Antagonistic interactions between the cAMP-dependent protein kinase and Tor signaling pathways modulate cell growth in Saccharomyces cerevisiae

Affiliations

Antagonistic interactions between the cAMP-dependent protein kinase and Tor signaling pathways modulate cell growth in Saccharomyces cerevisiae

Vidhya Ramachandran et al. Genetics. 2011 Feb.

Abstract

Eukaryotic cells integrate information from multiple sources to respond appropriately to changes in the environment. Here, we examined the relationship between two signaling pathways in Saccharomyces cerevisiae that are essential for the coordination of cell growth with nutrient availability. These pathways involve the cAMP-dependent protein kinase (PKA) and Tor proteins, respectively. Although these pathways control a similar set of processes important for growth, it was not clear how their activities were integrated in vivo. The experiments here examined this coordination and, in particular, tested whether the PKA pathway was primarily a downstream effector of the TORC1 signaling complex. Using a number of reporters for the PKA pathway, we found that the inhibition of TORC1 did not result in diminished PKA signaling activity. To the contrary, decreased TORC1 signaling was generally associated with elevated levels of PKA activity. Similarly, TORC1 activity appeared to increase in response to lower levels of PKA signaling. Consistent with these observations, we found that diminished PKA signaling partially suppressed the growth defects associated with decreased TORC1 activity. In all, these data suggested that the PKA and TORC1 pathways were functioning in parallel to promote cell growth and that each pathway might restrain, either directly or indirectly, the activity of the other. The potential significance of this antagonism for the regulation of cell growth and overall fitness is discussed.


Figures
F<sc>igure</sc> 1.—
Figure 1.—
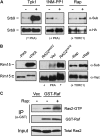
Assessing the effects of rapamycin on reporters of Ras/PKA signaling activity. (A) The PKA phosphorylation of Srb9 did not decrease upon rapamycin treatment. The relative level of PKA phosphorylation on Srb9 was assessed by Western blotting with an anti-PKA substrate antibody (α-Sub), as described in materials and methods. This antibody specifically recognizes a PKA phosphorylated form of Srb9 (Chang et al. 2004). Ras/PKA signaling levels were up- or downregulated by either inducing expression from the CUP1-TPK1 construct (Tpk1) or inactivating the tpk1-as allele with the drug 1NM-PP1, respectively. Rapamycin was added to a final concentration of 200 ng/ml where indicated (Rap), and the relative levels of Srb9 phosphorylation were assessed after 2 hr of incubation. The parenthetical notations indicate the effects that the experimental conditions had on PKA or TORC1 signaling activity. (B) The extent of PKA phosphorylation on Rim15 was not diminished upon the inactivation of TORC1. The relative level of PKA phosphorylation was assessed by Western blotting with the anti-PKA substrate antibody (α-Sub). (Left) The Rim15 fragment was precipitated from yeast cell extracts and then treated with λ-phosphatase. The sample was washed and split into two aliquots. One aliquot was mock-treated (−PKA) and the second was subjected to an in vitro kinase reaction with bPKA and 2.5 mm ATP (+PKA). (Middle) The relative level of PKA phosphorylation was assessed in cells containing inducible forms of either the dominant-negative allele RAS2ala22 or the dominant-positive allele RAS2val19. Expression of each construct was induced from the MET3 promoter by transferring cells to a methionine-free medium for 2 hr. Vec, vector control. (Right) Rapamycin was added at a final concentration of 200 ng/ml for 2 hr before assessing the relative amount of PKA phosphorylation on the Rim15 reporter. (C) Assessing the effects of rapamycin on the levels of active, GTP-bound Ras2. The levels of Ras2-GTP were assessed as described in materials and methods. Briefly, a GST fusion protein containing the Ras-binding domain of the mammalian Raf-1 protein (GST-Raf) was used to precipitate the active, GTP-bound Ras2 from cell extracts. The extracts were prepared from cells that had been treated with 0 or 200 ng/ml rapamycin for 2 hr. The amount of precipitated Ras2 protein was then assessed by Western blotting with an anti-Ras2 antibody (Ras2-GTP). The “Input” panel shows the total amount of Ras2 present in each cell extract (“Total Ras2”).
F<sc>igure</sc> 2.—
Figure 2.—
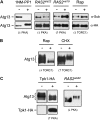
Atg13 as a reporter for both Ras/PKA and TORC1 signaling activity. (A) Decreased TORC1 signaling resulted in elevated levels of PKA phosphorylation on Atg13. The PKA phosphorylation level of Atg13 was assessed by Western blotting with the anti-PKA substrate antibody (α-Sub). Controls indicating that this Atg13 signal was responsive to Ras/PKA signaling levels in the cell are shown. Decreased Ras/PKA signaling was achieved by addition of the inhibitor, 1NM-PP1, to the tpk1-as strain or by expression of an inducible dominant-negative RAS2ala22 construct. Elevated Ras/PKA activity was achieved by the expression of an inducible dominant-positive allele of RAS2, RAS2val19. The notation beneath each panel indicates the expected effects on TORC1 signaling activity. (B) The anomalous migration of Atg13 on SDS-polyacrylamide gels can be used as an in vivo measure of TORC1 signaling activity. The extent of the Atg13 “smear” was assessed in cells that had been treated with 200 ng/ml rapamycin (Rap) or 50 μg/ml cycloheximide (CHX) for 1 hr by Western blotting with an anti-myc antibody. Note that the extent of the Atg13 smear is dependent upon the running conditions of the gel. For example, a shorter separation time was used to obtain the tighter bands in A. (C) The relative level of the TORC1 dependent phosphorylation of Atg13 was inversely proportional to Ras/PKA signaling levels. The extent of the Atg13 smear was assessed by Western blotting with an antibody specific for the HA epitope. Elevated Ras/PKA signaling was achieved by overexpression of an HA epitope-tagged Tpk1 (Tpk1-HA) and decreased signaling by the expression of an inducible dominant-negative RAS2ala22 construct.
F<sc>igure</sc> 3.—
Figure 3.—
Cki1 phosphorylation can be used to report on the in vivo levels of Ras/PKA signaling activity. (A) A schematic of the Cki1 protein showing the positions of the two serine residues recognized by PKA, Ser-30, and Ser-85 and the choline kinase domain (light shading). The position of the putative PKC site, Ser-25, is also shown. The portion of the Cki1 protein expressed in the Cki1 reporter fragment used here is shown with dark shading. The asterisk indicates the PKA site, Ser-85, responsible for the anomalous migration of the Cki1 reporter construct. (B) The altered mobility of Cki1 on SDS-polyacrylamide gels was the result of PKA phosphorylation. The indicated versions of the Cki1 fragment were precipitated from yeast cell extracts and then treated with λ-phosphatase, as indicated. The fragments were washed and then incubated with bPKA and 2.5 mm ATP, as described in materials and methods. “Cki1-P*” refers to the PKA phosphorylated form of the Cki1 fragment that exhibited an altered mobility on gels. PPase, λ-phosphatase. (C) The presence of Ser-85 was necessary and sufficient for the Cki1 mobility shift in vivo. Extracts were prepared from yeast cells expressing the indicated Cki1 variants, and the gel mobility of each variant was assessed by Western blotting with an anti-myc antibody. (D) Ser-85 phosphorylation by PKA was responsible for the slower-migrating form of Cki1. The indicated Cki1 variants were immunoprecipitated from cell extracts and either mock-treated (−) or incubated with bPKA and [γ-32P]ATP. The reaction products were then separated on SDS-polyacrylamide gels, and the level of PKA phosphorylation was assessed by autoradiography (32P). The relative amount of the variants present in each reaction was assessed by Western blotting with an anti-myc antibody. (E) Elevated Ras/PKA signaling resulted in an increase in the relative levels of Cki1-P*. The relative level of Cki1-P* was assessed in cells containing a TPK1, RAS2val19, or vector plasmid by Western blotting with an anti-myc antibody. The TPK1 gene was overexpressed from the copper-inducible CUP1 promoter. (F) Inactivation of Ras/PKA signaling resulted in diminished levels of Cki1-P*. The Cki1 fragment was expressed in a yeast strain, Y3175, that had an analog-sensitive allele of TPK1 as the sole source of PKA activity. This Tpk1 variant was inactivated by the addition of the inhibitor, 1NM-PP1 (1NM). The relative level of Cki1-P* was assessed after 4 hr of incubation with 10 μm 1NM-PP1.
F<sc>igure</sc> 4.—
Figure 4.—
Inactivation of TORC1 signaling resulted in an increase in the PKA phosphorylation of Cki1. (A) TORC1 inactivation by rapamycin caused an increase in the relative levels of Cki1-P*. The relative levels of Cki1-P* were assessed in cell extracts after a 2-hr incubation with 20 (Lo) or 200 (Hi) ng/ml of rapamycin. (B) The relative levels of Cki1-P* were not elevated in prt1- or cdc28-arrested cells. Wild-type, prt1-1, and cdc28-1 cells were grown to mid-log phase at 25° and then shifted to the nonpermissive temperature of 39° for 8 hr. Cell extracts were prepared and the relative levels of Cki1-P* were assessed by Western blotting. The strains analyzed were PHY1682 (Wild type, Wt), PHY1086 (prt1), and PHY1235 (cdc28). (C) The relative increase in Cki1-P* levels was coincident with the rapamycin-mediated inhibition of growth. A growth curve showing cell density in cultures treated with either 0 (−R) or 200 (+R) ng/ml rapamycin. The point of rapamycin addition (t = 0) is indicated by the arrow. (D) A Western blot showing the relative levels of Cki1-P* in the same culture at the indicated times after the addition of 200 ng/ml rapamycin. The 3(−R) sample shows the level of Cki1-P* in the control culture that was incubated for 3 hr in the absence of rapamycin. The relative amount of Cki1 present in each band was assessed with the ImageJ software program and the Cki1-P*/Cki1 ratio is shown for each time point.
F<sc>igure</sc> 5.—
Figure 5.—
Diminished Ras/PKA signaling was associated with an increased resistance to rapamycin. (A) The temperature-sensitive ras2-23 strain exhibited an increased resistance to rapamycin at a semipermissive temperature. Equal amounts of log-phase cells of the indicated genotypes were collected, diluted in water, and spotted onto YPAD plates in a series of fivefold dilutions. The plates were incubated at the permissive (25°) or semipermissive (30°) temperature for 2–3 days with the indicated concentrations of rapamycin. The strains analyzed were PHY1682 (Wild-type), PHY1120 (ras1 RAS2), and PHY1150 (ras1 ras2-23). (B) The effects of rapamycin on the growth of prt1-1 and cdc28-1 mutants. Aliquots of the indicated strains were plated as described above and incubated for 2–3 days at the permissive (25°) or semipermissive (30°) temperature with the indicated concentration of rapamycin. The strains analyzed were PHY1682 (Wild-type), PHY1086 (prt1-1), and PHY1235 (cdc28-1). (C) Yeast bcy1Δ strains exhibited a heightened sensitivity to rapamycin. Aliquots of the indicated strains were plated as described above and incubated for 2–3 days at 30°. The concentration of rapamycin present is indicated at the right of the images.
F<sc>igure</sc> 6.—
Figure 6.—
The inverse relationship between Ras/PKA signaling activity and the resistance to rapamycin was observed in multiple genetic backgrounds. In A–C, log-phase cells were collected, diluted in water, and plated onto a minimal medium containing the indicated amounts of rapamycin. Each column represents a fivefold serial dilution of the sample to the immediate left. The plates were then incubated for 2–3 days at 30° before imaging. Each strain contained a single-copy RAS2val19 plasmid, a high-copy PDE2 construct, and a vector control. The genetic backgrounds of each of the tested strains are indicated: PHY1682 (W303 background), PHY1220 (SEY6210), and BY4741 (BY).
F<sc>igure</sc> 7.—
Figure 7.—
The growth defects associated with Tor pathway mutations were influenced by altered Ras/PKA signaling activity. (A) The presence of RAS2val19 exacerbated the slow growth phenotype of tor1Δ strains. Wild type, tor1Δ, and tor1Δ tor2ts cells containing either a vector or a RAS2val19 plasmid were grown to log phase and spotted onto YM-glucose plates. The plates were incubated at 37° for 2–3 days before imaging. The strains examined were JK9-3da (Wild-type), PLY297 (tor1Δ), and NB4-6a (tor1Δ tor2-21ts). (B) The temperature-sensitive growth defects of a tor2ts strain were suppressed by the overexpression of the Pde2 cAMP phosphodiesterase and exaggerated by the presence of RAS2val19. Wild-type (SH100) and tor2ts (SH121) cells carrying the indicated plasmids were grown to log phase, and serial dilutions of these cultures were plated to YM-glucose plates. The plates were then incubated at the indicated temperatures for 2–3 days before examination.
F<sc>igure</sc> 8.—
Figure 8.—
PKA activity in vivo was elevated in response to nitrogen starvation. (A) Nitrogen deprivation had opposing effects upon the PKA- and TORC1-dependent phosphorylation of Atg13. Yeast cells were grown to mid-log phase in SC-glucose minimal medium (SC) and then transferred to the nitrogen starvation medium, SD-N (−N), for 3 hr. The relative levels of the PKA- and TORC1-dependent phosphorylation on Atg13 were assessed by Western blotting with the anti-PKA substrate (α-Sub) or anti-HA (α-HA) antibodies, respectively. The Atg13 was resolved further to achieve the separation observed in the bottom panel. (B) The relative level of Cki1-P* was elevated in response to nitrogen deprivation. Cells containing the Cki1 reporter fragment were grown to mid-log phase in SC-glucose minimal medium and then transferred to a SC medium lacking glucose for 15 min or to an SD-N medium for 3 hr. The relative levels of Cki1-P* were then determined by Western blotting. Note that the levels of Cki1-P* were dramatically reduced upon carbon starvation. (C) The level of PKA phosphorylation on Srb9 was elevated in response to nitrogen limitation. The nitrogen and carbon starvations were carried out as described in B, except that the incubation period in the SC medium lacking glucose was 60 min. The Srb9 was then precipitated from these cell extracts, and the extent of PKA phosphorylation was assessed by Western blotting with the anti-PKA substrate antibody (α-Sub).

Similar articles

Cited by

References

    1. Abramoff, M. D., P. J. Magelhaes and S. J. Ram, 2004. Image processing with ImageJ. Biophotonics Int. 11 36–42.
    1. Araki, T., Y. Uesono, T. Oguchi and E. A. Toh, 2005. LAS24/KOG1, a component of the TOR complex 1 (TORC1), is needed for resistance to local anesthetic tetracaine and normal distribution of actin cytoskeleton in yeast. Genes Genet Syst. 80 325–343. - PubMed
    1. Bahn, Y. S., C. Xue, A. Idnurm, J. C. Rutherford, J. Heitman et al., 2007. Sensing the environment: lessons from fungi. Nat. Rev. Microbiol. 5 57–69. - PubMed
    1. Beugnet, A., A. R. Tee, P. M. Taylor and C. G. Proud, 2003. Regulation of targets of mTOR (mammalian target of rapamycin) signalling by intracellular amino acid availability. Biochem. J. 372 555–566. - PMC - PubMed
    1. Bishop, A. C., K. Shah, Y. Liu, L. Witucki, C. Kung et al., 1998. Design of allele-specific inhibitors to probe protein kinase signaling. Curr. Biol. 8 257–266. - PubMed

Publication types

MeSH terms

Substances