

doi: 10.1104/pp.110.165886.
Epub 2010 Nov 15.
Optimizing antenna size to maximize photosynthetic efficiency
Affiliations
- PMID: 21078863
- PMCID: PMC3014228
- DOI: 10.1104/pp.110.165886
Item in Clipboard
Optimizing antenna size to maximize photosynthetic efficiency
Plant Physiol.
2011 Jan.
No abstract available
Figures
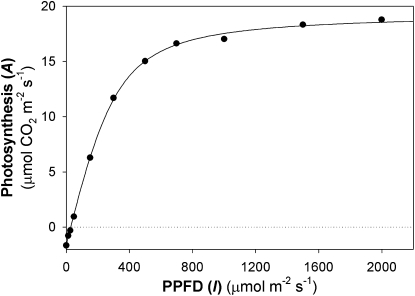
The light intensity dependence of net photosynthesis of a chamber-grown tobacco leaf. The measurement temperature was 25°C and the [CO2] in the measurement chamber (LI-COR 6400-40) was 400 ppm. The data are fit to Equation 1, for which ΦCO2 = 0.059, Asat = 21.03 μmol CO2 m−2 s−1, θ = 0.79, and R = 1.65 μmol CO2 m−2 s−1.
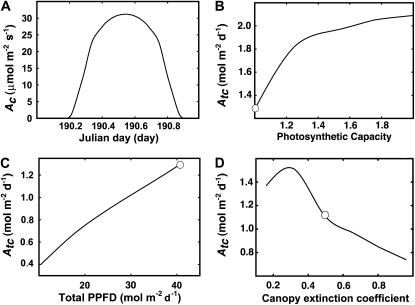
Simulations of the diurnal photosynthesis. Section A simulates a typical diurnal profile of the canopy photosynthetic CO2 uptake rate (Ac) for day of year 190 at 52°N latitude for a LAI of 3. The changes of the photon flux density were achieved in WIMOVAC by changing the day of year used in the simulation. The modeled responses of the total daily integral gross canopy photosynthetic CO2 uptake rate (Atc) are shown for changes in the photosynthetic capacities (i.e. Vcmx and Jmax relative to the default value; B), total PPFD (C), and canopy extinction coefficient (D). For A to C, the default LAI is 3, canopy extinction coefficient is 0.5, and total leaf reflectance and transmittance is 0.2 (Humphries and Long, 1995). For D, the assumed Chl concentration is 0.5 mmol Chl m−2. The default values in B to D are shown by white circles. The canopy extinction coefficient was assumed to change proportionally with the changes in the leaf Chl concentration. We used the relationship between Chl concentration and the initial slope of the light response curve Φ from Hikosaka and Terashima (1995). The relationship between Chl concentration and leaf absorbance follows Evans (1993). In all these simulations, the light environments were predicted using WIMOVAC as done by Zhu et al. (2004b). In B and C, the daily total photosynthesis was calculated following Zhu et al. (2004b). In D, the daily total canopy photosynthesis was calculated based on Equations 1, 5, 6, and the predicted light environments using WIMOVC (with Amax 25 μmol m−2 s−1 and θ as 0.7). The detailed equations used in these WIMOVAC simulations are reproduced here in Supplemental Appendices S1 and S2 .
References
-
- Beale CV, Long SP. (1995) Can perennial C4 grasses attain high efficiencies of radiant energy-conversion in cool climate. Agric For Meteorol 96: 103–115
-
- Dismukes GC, Carrieri D, Bennette N, Ananyev GM, Posewitz MC. (2008) Aquatic phototrophs: efficient alternatives to land-based crops for biofuels. Curr Opin Biotechnol 19: 235–240 - PubMed
MeSH terms
Substances
LinkOut - more resources
Full Text Sources
Other Literature Sources
