. 2010 Nov 22;207(12):2551-9.
doi: 10.1084/jem.20102017. Epub 2010 Nov 15.

Targeting of B and T lymphocyte associated (BTLA) prevents graft-versus-host disease without global immunosuppression

Affiliations

Targeting of B and T lymphocyte associated (BTLA) prevents graft-versus-host disease without global immunosuppression

Jörn C Albring et al. J Exp Med. .

Abstract

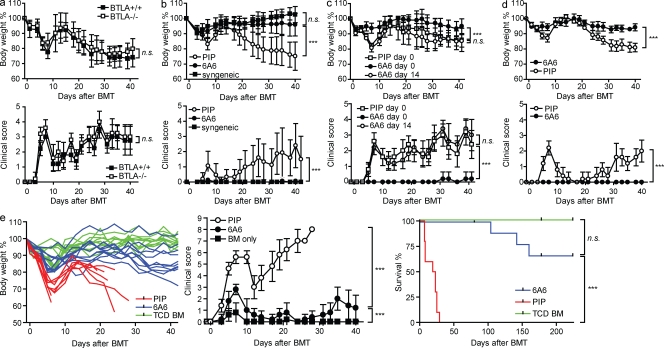
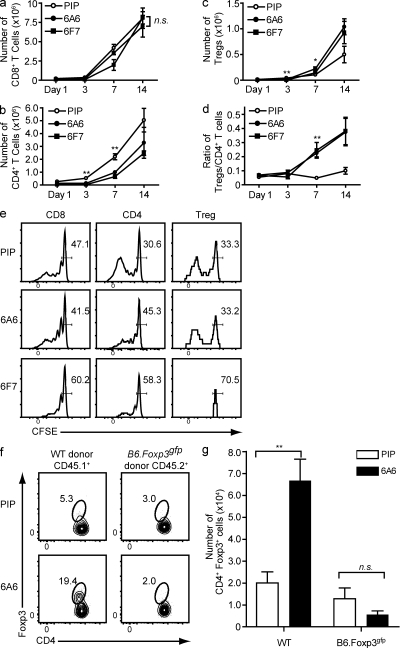
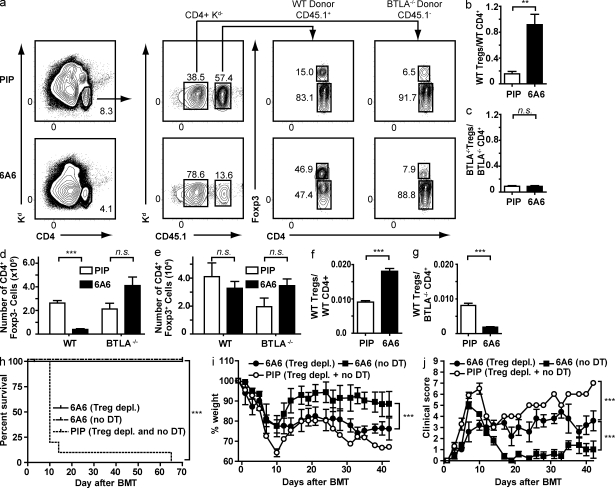
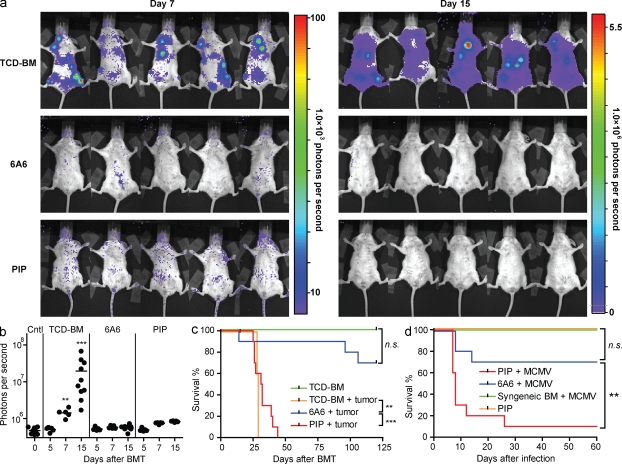
Graft-versus-host disease (GVHD) causes significant morbidity and mortality in allogeneic hematopoietic stem cell transplantation (aHSCT), preventing its broader application to non-life-threatening diseases. We show that a single administration of a nondepleting monoclonal antibody specific for the coinhibitory immunoglobulin receptor, B and T lymphocyte associated (BTLA), permanently prevented GVHD when administered at the time of aHSCT. Once GVHD was established, anti-BTLA treatment was unable to reverse disease, suggesting that its mechanism occurs early after aHSCT. Anti-BTLA treatment prevented GVHD independently of its ligand, the costimulatory tumor necrosis factor receptor herpesvirus entry mediator (HVEM), and required BTLA expression by donor-derived T cells. Furthermore, anti-BTLA treatment led to the relative inhibition of CD4(+) forkhead box P3(-) (Foxp3(-)) effector T cell (T eff cell) expansion compared with precommitted naturally occurring donor-derived CD4(+) Foxp3(+) regulatory T cell (T reg cell) and allowed for graft-versus-tumor (GVT) effects as well as robust responses to pathogens. These results suggest that BTLA agonism rebalances T cell expansion in lymphopenic hosts after aHSCT, thereby preventing GVHD without global immunosuppression. Thus, targeting BTLA with a monoclonal antibody at the initiation of aHSCT therapy might reduce limitations imposed by histocompatibility and allow broader application to treatment of non-life-threatening diseases.


Figures

Figure 1.
Figure 1.
Anti-BTLA treatment permanently prevents GVHD. (a) Lethally irradiated CB6F1 mice received BMC and splenocytes from C57BL/6 WT (closed squares, n = 5) or BTLA−/− (open squares, n = 5) donors. (b) Lethally irradiated CB6F1 mice received BMC and splenocytes from syngeneic donors (closed squares, n = 10), C57BL/6 mice and antibodies PIP (open circles, n = 15), or 6A6 (closed circles, n = 15). Shown are cumulative data from three independent experiments. (c) Lethally irradiated CB6F1 mice received BMC and splenocytes from C57BL/6 mice plus control antibody PIP (open circles, n = 5) or 6A6 (closed circles, n = 5) on the day of BMT or 6A6 14 d after BMT (open squares, n = 5). (d) Lethally irradiated CB6F1 mice received BMC and splenocytes from C57BL/6 HVEM−/− mice and control antibody PIP (open circles, n = 5) or 6A6 (closed circles, n = 5). (e) Lethally irradiated BALB/c mice received TCD-BM alone (green lines and closed squares, n = 10) or in combination with splenocytes from C57BL/6 mice and control antibody PIP (red lines and open circles, n = 10) or 6A6 (blue lines and closed circles, n = 10) on the day of BMT. Shown are cumulative data from two independent experiments. Weight and clinical score data shown are mean ± SD. Data are representative of two independent experiments with five mice per group or cumulative data from independent experiments as indicated. P-values of >0.05 are considered not significant (n.s). ***, P < 0.001.
Figure 2.
Figure 2.
Anti-BTLA treatment allows for the expansion of preexisting donor-derived T reg cells by inhibiting T eff cell proliferation. (a–e) Lethally irradiated CB6F1 mice received a CFSE-labeled graft from B6.SJL donors and were treated with control antibody PIP (open circles), 6A6 (closed circles), or 6F7 (closed squares; n = 3 per group). The number of CD8+ T cells (a), CD4+Foxp3 (b), and CD4+ Foxp3+ (c) was calculated from absolute numbers of live splenocytes, and the percentage of the lymphocyte population was assayed by flow cytometry. (d) The ratio of total CD4+Foxp3+/CD4+Foxp3 cells was calculated at the indicated time points by dividing the number of T reg cells in c by the number of T eff cells in b. (e) CFSE intensity of CD8+, CD4+Foxp3, and CD4+Foxp3+, 3 d after aHSCT with PIP, 6A6, or 6F7 treatment. (f and g) Lethally irradiated CB6F1 mice received aHSCT from B6.SJL mice along with purified CD4+ Foxp3-negative T cells from B6.Foxp3gfp mice with control antibody (PIP) or 6A6 (n = 5 per group). After 7 d, splenocytes were assayed by flow cytometry to determine the relative frequency of CD4+Foxp3+ cells among CD4+ cells (f) or the absolute number of CD4+Foxp3+ T reg cells (g). Statistical comparisons in a–d are between the PIP- and 6A6-treated groups at the indicated time point, and the data are displayed as mean ± SEM. Shown are representative data from two independent experiments with three to five mice per group. P-values of >0.05 are considered not significant (n.s). *, 0.01 < P < 0.05; **, 0.001 < P < 0.01.
Figure 3.
Figure 3.
Direct engagement of BTLA on T eff cells leads to an increased frequency of CD4+Foxp3+ cells. Lethally irradiated CB6F1 mice received a 1:1 mixed aHSCT with WT-B6.SJL and B6 BTLA−/− donor cells (a–e) with either control antibody (PIP) or 6A6 (n = 5 per group). After 7 d, splenocytes were analyzed by flow cytometry. (a) Shown are FACS plots to identify donor cells as H-2Kd− and CD4+ (left). Intracellular Foxp3 was detected among CD4+ T cells (right) gated on WT-B6.SJL (CD4+CD45.1+ H-2Kd−) or B6 BTLA+/+ (CD4+CD45.1 H-2Kd−) donor cell populations as indicated. Numbers represent the percentage of cells within the indicated gates. The ratios of the number of WT T reg/WT T eff cells (b) and KO T reg/ KO T eff cells (c) are shown, as well as the total number of T eff cells (d) and T reg cells (e) from the indicated donors after treatment with control antibody (PIP, open bars) or 6A6 (closed bars). (f and g) Lethally irradiated BALB/c mice received a 1:1 mixture of purified WT-B6.SJL and BTLA−/− CD4+ cells and T reg cells from B6.Foxp3gfp mice, with either control antibody PIP or 6A6 (n = 3–4 per group). After 7 d, splenocytes were analyzed by flow cytometry to determine the ratio of WT T reg/WT T eff cells (f) or WT T reg/BTLA−/− T eff cells (g). Data are displayed as mean ± SEM. Shown are representative data from two independent experiments. (h–j) Recipient BALB/c mice received TCD-BM and splenocytes from T reg cell ablated or unmanipulated Foxp3DTR mice and PIP or 6A6 as indicated. Survival curves (h), weight curves (i), and clinical scores (j) are shown for 6A6-treated mice that received a graft from either untreated (no DT) Foxp3DTR donors (dashed line or filled squares; n = 5) or a graft from DT-treated (T reg depl.) Foxp3DTR donors (solid line or filled circles; n = 5) and PIP-treated mice that received a graft from DT-treated or untreated (T reg depl. and no DT) Foxp3DTR donors (dotted line or open circles; n = 10). Data are shown as mean ± SD from two independent experiments. P-values of >0.05 are considered not significant (n.s). **, 0.001 < P < 0.01; ***, P < 0.001.
Figure 4.
Figure 4.
Anti-BTLA treatment does not lead to global immunosuppression. (a) Representative images of A20-Luc tumor cell localization 7 d (left) and 15 d (right) after aHSCT in lethally irradiated BALB/c mice that had received A20-Luc lymphoma cells with TCD-BM alone (n = 10) or together with splenocytes from C57BL/6 mice and control antibody PIP (n = 10) or 6A6 (n = 10). (b) Shown are units of photons per second for individual animals from panel a for days 5 (n = 5), 7 (n = 5), and 15 (n = 10) after aHSCT, as well as unmanipulated BALB/c mice (day 0, n = 12) for comparison. Asterisks indicate statistically significant differences between TCD-BM and 6A6 groups. Shown are cumulative data from two independent experiments, with each point representing the BLI signal from an individual mouse. Horizontal lines represent the mean BLI signal. Vertical lines serve to separate experimental groups. (c) Survival data of mice from a and from mice that received TCD-BM alone without tumor for comparison. Shown are cumulative data from two independent experiments. (d) CB6F1 BMC and splenocytes from syngeneic (green line; n = 10) or C57BL/6 donors and antibodies PIP (red line; n = 10) or 6A6 (blue line; n = 10) were infected with MCMV 4 wk after aHSCT and were monitored for survival. PIP-treated uninfected mice (orange line, n = 10) served as controls. Shown are cumulative data from two independent experiments. Data are shown as mean ± SD from two independent experiments. P-values of >0.05 are considered not significant (n.s). **, 0.001 < P < 0.01; ***, P < 0.001.

Similar articles

Cited by

References

    1. Blazar B.R., Carreno B.M., Panoskaltsis-Mortari A., Carter L., Iwai Y., Yagita H., Nishimura H., Taylor P.A. 2003. Blockade of programmed death-1 engagement accelerates graft-versus-host disease lethality by an IFN-gamma-dependent mechanism. J. Immunol. 171:1272–1277 - PubMed
    1. Chen W., Jin W., Hardegen N., Lei K.J., Li L., Marinos N., McGrady G., Wahl S.M. 2003. Conversion of peripheral CD4+CD25− naive T cells to CD4+CD25+ regulatory T cells by TGF-β induction of transcription factor Foxp3. J. Exp. Med. 198:1875–1886 10.1084/jem.20030152 - DOI - PMC - PubMed
    1. Cooke K.R., Kobzik L., Martin T.R., Brewer J., Delmonte J., Jr, Crawford J.M., Ferrara J.L.M. 1996. An experimental model of idiopathic pneumonia syndrome after bone marrow transplantation: I. The roles of minor H antigens and endotoxin. Blood. 88:3230–3239 - PubMed
    1. Copelan E.A. 2006. Hematopoietic stem-cell transplantation. N. Engl. J. Med. 354:1813–1826 10.1056/NEJMra052638 - DOI - PubMed
    1. Edinger M., Cao Y.A., Verneris M.R., Bachmann M.H., Contag C.H., Negrin R.S. 2003a. Revealing lymphoma growth and the efficacy of immune cell therapies using in vivo bioluminescence imaging. Blood. 101:640–648 10.1182/blood-2002-06-1751 - DOI - PubMed

Publication types

MeSH terms

Substances