. 2011 Jan 27;117(4):1228-38.
doi: 10.1182/blood-2010-05-287821. Epub 2010 Nov 15.

Constitutive reductions in mTOR alter cell size, immune cell development, and antibody production

Affiliations

Constitutive reductions in mTOR alter cell size, immune cell development, and antibody production

Shuling Zhang et al. Blood. .

Abstract

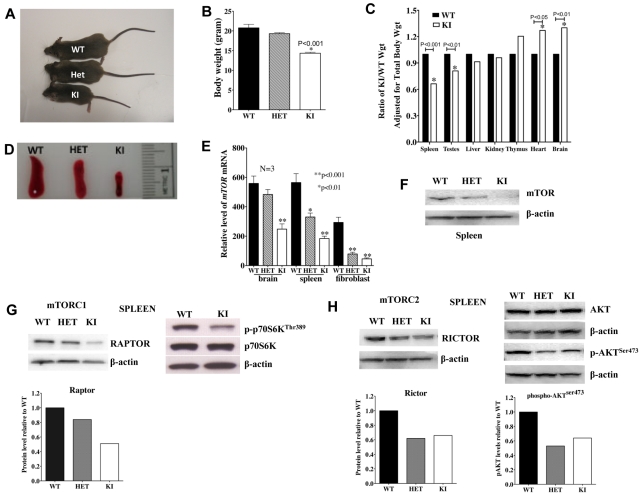
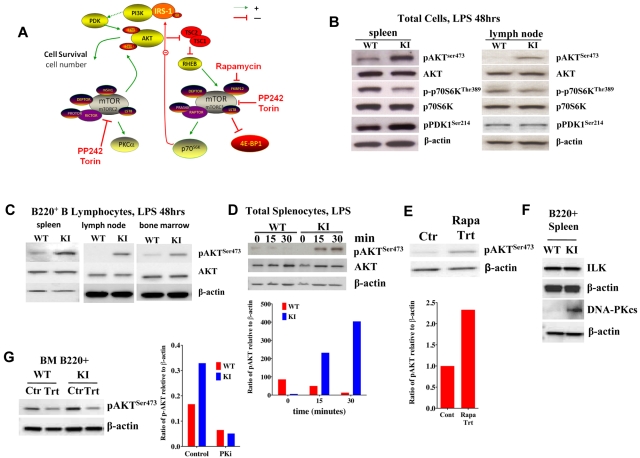
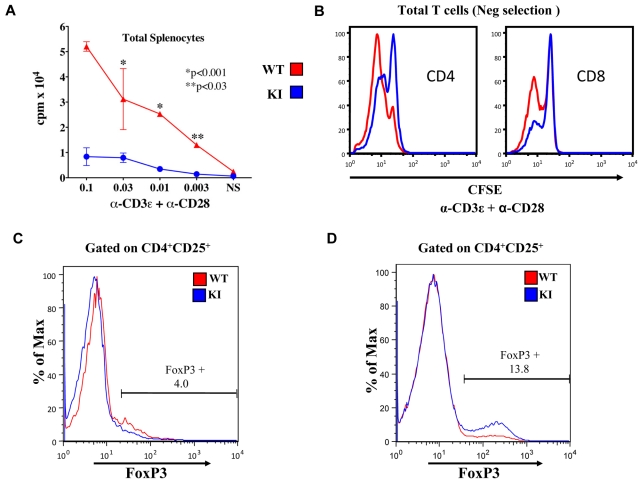
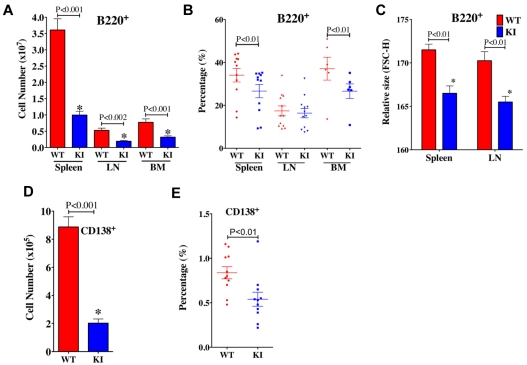
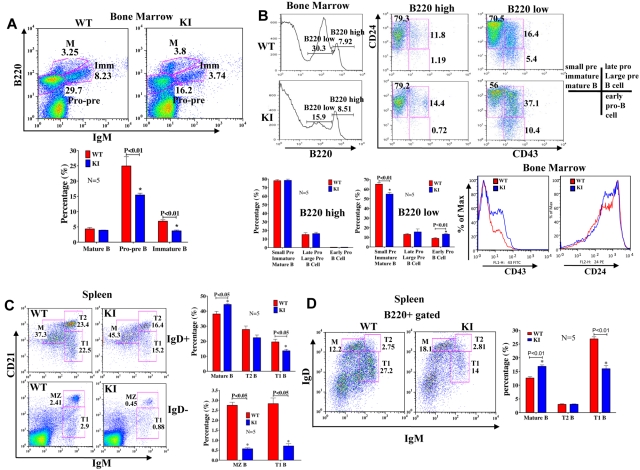
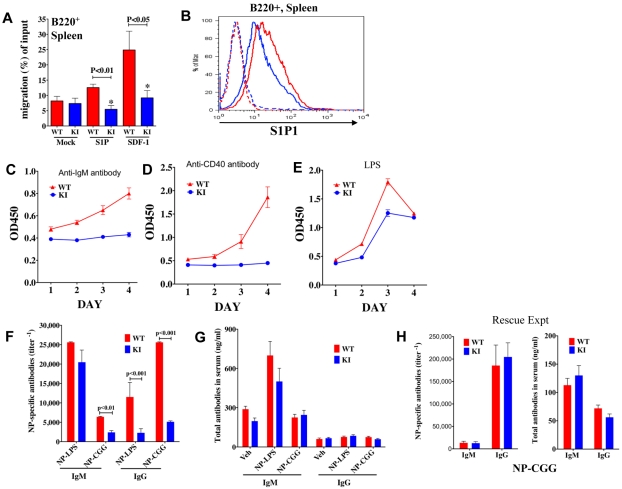
Mammalian TOR (mTOR) regulates cell growth, proliferation, and migration. Because mTOR knock-outs are embryonic lethal, we generated a viable hypomorphic mouse by neo-insertion that partially disrupts mTOR transcription and creates a potential physiologic model of mTORC1/TORC2 inhibition. Homozygous knock-in mice exhibited reductions in body, organ, and cell size. Although reductions in most organ sizes were proportional to decreased body weight, spleens were disproportionately smaller. Decreases in the total number of T cells, particularly memory cells, and reduced responses to chemokines suggested alterations in T-cell homing/homeostasis. T-cell receptor-stimulated T cells proliferated less, produced lower cytokine levels, and expressed FoxP3. Decreased neutrophil numbers were also observed in the spleen, despite normal development and migration in the bone marrow. However, B-cell effects were most pronounced, with a partial block in B-cell development in the bone marrow, altered splenic populations, and decreases in proliferation, antibody production, and migration to chemokines. Moreover, increased AKT(Ser473) phosphorylation was observed in activated B cells, reminiscent of cancers treated with rapamycin, and was reduced by a DNA-pk inhibitor. Thus, mTOR is required for the maturation and differentiation of multiple immune cell lineages. These mice provide a novel platform for studying the consequences of constitutively reduced mTORC1/TORC2 activity.


Figures

Figure 1
Figure 1
mTOR expression affects body and organ weight as well as TORC1 and TORC2 activity. (A-B) Body sizes and weights of KI mice are less than that observed in age-matched WT and HET mice (N = 7 each). (C) KI organ weights are adjusted for body weight and shown as a proportion of the WT organ weight also adjusted for body weight. All data are from 7 mice (age, 57 days). (D) Spleens of KI mice are small and disproportionately reduced compared with other organs. (E) Relative mRNA expression of mTOR in brain, spleen, and fibroblasts of WT, HET, and KI mice (N = 3 each). (F) Protein levels of mTOR (C-terminal antibody) were lower in spleens of KI mice. Basal RAPTOR (G) and RICTOR (H) protein expression was reduced in spleens of HET and KI mice (top left: Western blot; bottom left: protein level relative to WT, normalized with β-actin). In KI splenocytes, lower mTOR levels resulted in less phosphorylation of TORC1 target p-p70SKThr389 (G, top right) and TORC2 target p-AKTSer473 (H, top right: Western blot; bottom right: protein level relative to WT, normalized with total β-actin).
Figure 2
Figure 2
TORC1/TORC2 signaling in activated lymphocytes. (A) Schematic representing a simplified signaling pathway for TORC1/TORC2 (using ScienceSlides objects, Suite 2009). The dotted green line indicates that the signaling is not direct. (B) AKT and p70S6K phosphorylation in LPS-stimulated (48 hours) cells from spleens and LNs of KI versus WT mice. p-p70S6K levels remained low, as in unstimulated cells, whereas pAKT levels increased. (C) AKTSer473 phosphorylation in LPS-stimulated (48 hours) B220+ lymphocytes from spleens, LNs, and BM increased in KI mice compared with WT. (D) Time course (0, 15, and 30 minutes) of pAKTSer473 induction in splenocytes stimulated with LPS. (E) pAKTSer473 levels in control/untreated L363 myeloma cells versus cells treated with 10nM rapamycin for 24 hours. (F) ILK and DNA-PKcs in B220+ splenocytes stimulated with LPS after 24 hours. (G) pAKTSer473 induction (48 hours) in cells pretreated for 2 hours with 20μM of the DNA-PKcs inhibitor NU7026 and then stimulated with LPS.
Figure 3
Figure 3
T-cell proliferation and differentiation in the spleen. (A) WT splenocytes stimulated with α-CD3ϵ + α-CD28 proliferated better than KI splenocytes as measured by tritiated thymidine incorporation (P < .001, **P < .03). This is representative of 3 experiments. (B) Stimulated WT (red) splenic T cells proliferated more rapidly than KI (blue) cells as evidenced by the lower carboxyfluorescein succinimidyl ester (CFSE) staining (72 hours). (C) FoxP3 expression in unstimulated CD4+, CD25+ cells was similar in WT (5.4%) and KI (4.0%) mice. (D) Increased percentages of FoxP3+ cells in purified KI splenic T cells stimulated with α-CD3ϵ/WT antigen-presenting cells for 3 days followed by culture in interleukin-2 for 3 days (WT 3.9% FoxP3+ vs KI 13.8% FoxP3+). Data are representative of 4 experiments.
Figure 4
Figure 4
B-cell populations in lymphoid organs. (A) Total numbers of B220+ B cells are less in KI spleens, LNs, and BM compared with WT. (B) The frequency of B220+ cells was reduced in spleens and BM of KI mice, but not LNs. (C) The relative sizes of B cells in the spleen and LN were smaller in KI mice. (D) The total number of CD138+ plasma cells was also less in the spleens of KI mice. (E) The frequency of CD138+ cells was reduced in spleens of KI mice. For all panels, N = 6 to 12; age, 8 to 9 weeks.
Figure 5
Figure 5
B-cell subpopulations are altered in the BM and spleen. (A) Cells isolated from BM of WT and KI mice (N = 5 each) were stained with antibodies to IgM and B220. Populations are labeled as follows: M indicates mature B cells; IMM, immature B cells; and Pro-pre, Pro/Pre B cells. There were fewer Pro/Pre and immature B cells in KI mice. (B) Cells isolated from the BM of WT and KI mice were stained with antibodies to B220, CD24, and CD43. Stages of B-cell development are based on the following: B220+CD24+CD43: small pre-B, immature B, and mature B cells; B220+CD24+CD43+: late pro-B and large pre-B cells; B220+CD24CD43+: early pro-B cells. Populations of CD43+ and CD24+ cells from the BM of WT and KI mice. There were more CD43+, CD24+ cells in the KI compared with WT mice. (C) Flow cytometric analyses revealed that mature B-cell populations were increased in KI spleens. (D) B220+ cells were also stained with IgM and IgD antibodies, and stages of B cells were identified by the following cell surface markers: M indicates mature B cells (B220+ IgDhighCD21+IgM); T, transitional B cells (T1, B220+IgDloCD21loIgMhigh; T2, B220+IgDhighCD21highIgMhigh); and MZ, marginal zone B cells (B220+IgDCD21highIgMhigh). Sample sizes for these experiments were 5 mice/group (ages, 8 to 9 weeks) and are representative of repeat experiments.
Figure 6
Figure 6
B-cell migration, proliferation, and antibody production. (A) Migration (after 3 hours) of splenic B220+ cells from WT versus KI mice to chemokines S1P and SDF-1. (B) S1P1 (EDG1) receptor expression in splenic B220+ cells from KI (blue) and WT (red) mice. Dotted lines represent isotype controls. (C-E) Viability/cell growth curves in splenocytes of WT and KI mice were analyzed using WST-1. Viability/proliferation of total splenocytes stimulated with (C) α-IgM, or (D) α-CD40 was more compromised than proliferation of cells stimulated through the (E) TLR by LPS. (F) NP-specific IgM and IgG titers from sera of WT and KI mice immunized with either NP-LPS or NP-CGG. (G) WT and KI mice (n = 5 each) were immunized with either NP-LPS or NP-CGG, and total IgM and IgG antibody concentrations were examined in sera of mice at day 7 or day 14, respectively. (H) Crossing the KI mice to β-actin cre mice to produce KIneo− mice rescued antibody production in the neo-less KI mice. WT and KIneo− (neo-less) mice (N = 5 each) were immunized with NP-CGG and NP-specific antibody titers as well as total antibody concentrations measured in mouse sera at day 21; mice were given a boost at day 14.

References

    1. Guertin DA, Sabatini DM. Defining the role of mTOR in cancer. Cancer Cell. 2007;12(1):9–22. - PubMed
    1. Yang Q, Guan KL. Expanding mTOR signaling. Cell Res. 2007;17(8):666–681. - PubMed
    1. Astrinidis A, Cash TP, Hunter DS, Walker CL, Chernoff J, Henske EP. Tuberin, the tuberous sclerosis complex 2 tumor suppressor gene product, regulates Rho activation, cell adhesion and migration. Oncogene. 2002;21(55):8470–8476. - PubMed
    1. Sarbassov DD, Ali SM, Kim DH, et al. Rictor, a novel binding partner of mTOR, defines a rapamycin-insensitive and raptor-independent pathway that regulates the cytoskeleton. Curr Biol. 2004;14(14):1296–1302. - PubMed
    1. Barbet NC, Schneider U, Helliwell SB, Stansfield I, Tuite MF, Hall MN. TOR controls translation initiation and early G1 progression in yeast. Mol Biol Cell. 1996;7(1):25–42. - PMC - PubMed

Publication types

MeSH terms

Substances