. 2010 Nov 15;191(4):751-60.
doi: 10.1083/jcb.201008108.

Plk1 negatively regulates Cep55 recruitment to the midbody to ensure orderly abscission

Affiliations

Plk1 negatively regulates Cep55 recruitment to the midbody to ensure orderly abscission

Ricardo Nunes Bastos et al. J Cell Biol. .

Abstract

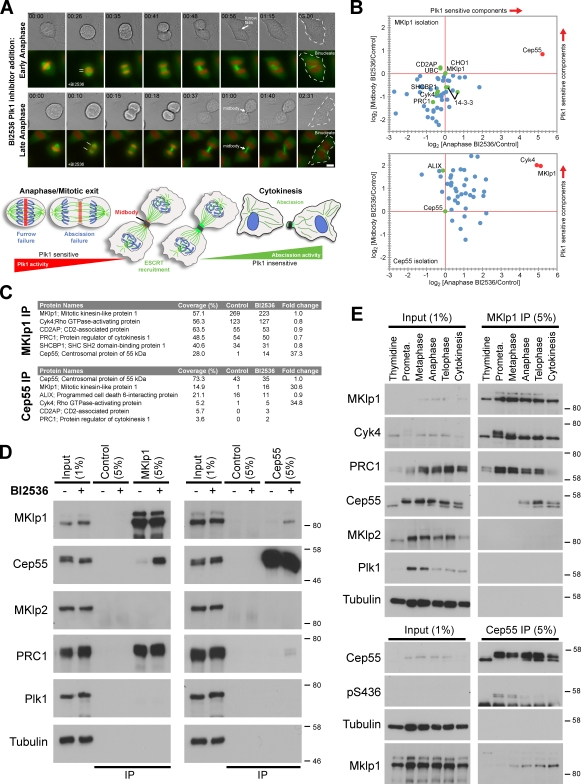
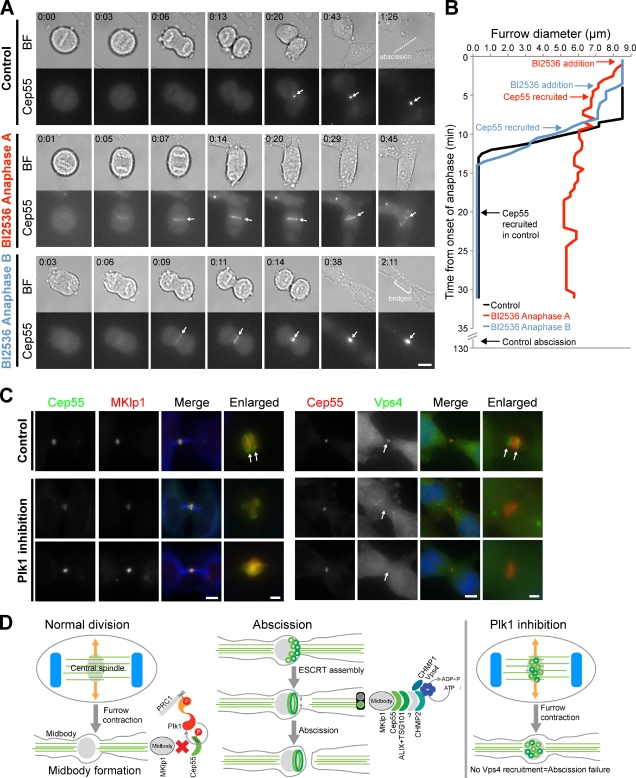
Cytokinesis requires a membrane-remodeling and fission event termed abscission that occurs after chromosome segregation, cleavage furrow formation, and contraction have completed. In this study, we show how abscission factor recruitment is controlled by the Polo-like kinase 1 (Plk1). At the metaphase-anaphase transition, Plk1 initiates cleavage furrow formation and is then progressively degraded during mitotic exit. During this period, Plk1 phosphorylates the abscission factor Cep55 in trans and prevents its untimely recruitment to the anaphase spindle. A Plk1 phosphorylation site mutant of Cep55 is prematurely recruited to the anaphase spindle and fails to support abscission. Endogenous Cep55 behaves similarly after Plk1 inhibition by the drugs BI2536 or GW842862. Only once Plk1 is degraded can Cep55 target to the midbody and promote abscission. Blocking Plk1 degradation leads to elevated levels of Plk1 at the midbody and the failure of Cep55 recruitment. Thus, Plk1 activity negatively regulates Cep55 to ensure orderly abscission factor recruitment and ensures that this occurs only once cell contraction has completed.


Figures

Figure 1.
Figure 1.
Plk1 phosphorylation negatively regulates the interaction of Cep55 with the midbody component MKlp1. (A, top) HeLa cells stably expressing EGFP-tagged α-tubulin (green) and mCherry-tagged histone H2B (red) were treated with 1 µM BI256. Still images from videos are indicated with arrows to mark the position of the midbody and intracellular bridge. Bar, 10 µm. (bottom) The model depicts the decay in Plk1 levels and activity in anaphase while chromosome segregation by the microtubule spindle is taking place and the outcomes of inhibiting Plk1 in early or late anaphase. Lines at the second time point indicate the extent of chromosome segregation. Dotted lines in the last time point mark the outline of the binucleate cells. (B) HeLa cells in anaphase or undergoing cytokinesis were treated with DMSO (control) or 1 µM BI2536 for 25 min. Cep55 and MKlp1 complexes were isolated with sheep antibodies and analyzed by quantitative nano liquid chromatography MS/MS. The ratio of identified proteins in BI2536 and control conditions was plotted for anaphase versus midbody stages. Green dots indicate midbody proteins, red dots mark proteins increased after Plk1 inhibition in anaphase, and blue dots indicate other proteins. (C) The response of midbody proteins to Plk1 inhibition is summarized in the table. The number of peptides found is listed in the control and BI2536 columns. Fold change in abundance based on the summed intensities of the peptides forming each protein group was calculated using MaxQuant. IP, immunoprecipitation. (D) The same samples were Western blotted. (E) Western blotting of MKlp1 and Cep55 complexes isolated from synchronized HeLa cells at the different stages of mitosis. Western blot markers are given in kilodaltons.
Figure 2.
Figure 2.
Plk1 phosphorylation negatively regulates central spindle recruitment of Cep55. (A) HeLa cells treated with DMSO, 1 µM BI2536, 5 µM flavopiridol, or 1 µM ZM447439 for 25 min were stained for DNA with DAPI and mouse anti–α-tubulin, rabbit anti-Cep55 (green), and goat anti-Plk1 (red). (B) HeLa cells transiently expressing EGFP-PRC1 or the Plk1-binding defective ST602AA mutant were transfected with control or PRC1 3′ untranslated region (UTR) siRNAs for 36 h. Cells were stained for DNA with DAPI, sheep anti-Cep55 (false-colored green in the merge), and goat anti-Plk1 (red). PRC1 was visualized using EGFP fluorescence. (C and D) Cep55 (C) and MKlp1 (D) complexes were isolated using sheep antibodies from mitotic HeLa cells treated with DMSO (control), 1 µM BI2536, or 1 µM ZM447439 for 25 min and then Western blotted. The asterisks indicate cross-reactivity to the heavy chain of the antibody used for immunoprecipitation. Western blot markers are given in kilodaltons. Bars, 10 µm.
Figure 3.
Figure 3.
Cep55 S436A is prematurely recruited to the central spindle in anaphase. (A) HeLa cells transiently expressing EGFP-tagged wild-type, TS46, 47AA, and S436A mutant Cep55 were stained for DNA with DAPI and mouse anti–α-tubulin. Bar, 10 µm. (B, left) HeLa cells stably expressing doxycycline-inducible mCherry-Cep55 or the S436A mutant of Cep55 were imaged as they exited mitosis. Insets in phase-contrast images show enlargements of the midbody region (arrows). Times are shown in hours and minutes from the onset of anaphase. Bar, 5 µm. (right) The time of Cep55 recruitment from the start of anaphase was measured in wild-type and S436A-expressing cells and is plotted as a bar graph (n = 10). Error bars indicate SD. (C) The fluorescence intensity of Cep55 was measured for the full 3D central spindle and midbody volume using the quantitation and tracking software and is plotted against time for both wild-type Cep55 and the S436A mutant–expressing cells. Arrows indicate the point of metaphase to anaphase transition obtained by inspection of the chromosomes in phase-contrast images. All timings are set relative to this point.
Figure 4.
Figure 4.
Plk1 destruction controls the timing of Cep55 recruitment to the midbody. (A) HeLa cells were mock treated or treated with 100 µM MG132 for 120 min and stained for DNA with DAPI and mouse anti–α-tubulin, rabbit anti-Cep55 or MKlp1 (green), and goat anti-Plk1 (red). Bars, 10 µm. The number of Plk1-positive and Cep55-negative midbody structures in the presence and absence of 100 µM MG132 was counted for 120 cells in each of three independent experiments. (B and C) HeLa cells stably expressing mCherry-Cep55 and either doxycycline-inducible EGFP-tagged wild-type Plk1 or the D-box mutant of Plk1 were imaged every minute with a spinning-disk confocal microscope. At the times indicated (arrows), 100 µM MG132 or 1 µM BI2536 was added. Fluorescence intensity of Plk1 and Cep55 was measured for the full central spindle and midbody volume and is plotted against time. A bar graph shows the times spent in the different stages of mitosis for 15 cells in three independent experiments. (D and E) Still images of Cep55 behavior in control, MG132, and BI2536 (D) cells and wild-type and D-box mutant Plk1 (E) cells are shown. Times are shown in hours:minutes. Error bars indicate SD. Bar, 5 µm.
Figure 5.
Figure 5.
Plk1 is required for furrow formation and abscission. (A) HeLa cells expressing mCherry-Cep55 were imaged as they exited mitosis after treatment with either DMSO or 1 µM BI2536. Fluorescence (Cep55) and brightfield (BF) still images from the live cell imaging shown in the bottom panels. BI2536 was added as chromosome segregation started in anaphase A or after chromosome segregation, but before furrowing in anaphase B. A dotted line marks abscission in the controls samples. Arrows indicate Cep55 recruitment to the central spindle or midbody. Times are shown in hours:minutes from the start of anaphase, defined as the time point before chromosome segregation was first detected. (B) The graph shows furrow diameter from the onset of anaphase measure in minutes. Arrows show the time of Cep55 recruitment and abscission, if this occurred. (C) HeLa cells treated with DMSO or 1 µM BI2536 for 25 min were stained for DNA with DAPI, mouse anti–α-tubulin (blue), rabbit anti-Cep55 (green), and sheep anti-MKlp1 (red). (right) HeLa cells expressing Vps4-EGFP and Cep55-mCherry were treated with DMSO or BI2536 for 25 min before fixation. Arrows mark the rings of Cep55 and Vps4 flanking the midbody position. (D) A model summarizing how the timely recruitment of Cep55 may be important for proper ESCRT function at the midbody. Bars: (main panels) 5 µm; (enlargements) 1 µm.

References

    1. Barr F.A., Gruneberg U. 2007. Cytokinesis: placing and making the final cut. Cell. 131:847–860 10.1016/j.cell.2007.11.011 - DOI - PubMed
    1. Barr F.A., Silljé H.H., Nigg E.A. 2004. Polo-like kinases and the orchestration of cell division. Nat. Rev. Mol. Cell Biol. 5:429–440 10.1038/nrm1401 - DOI - PubMed
    1. Brennan I.M., Peters U., Kapoor T.M., Straight A.F. 2007. Polo-like kinase controls vertebrate spindle elongation and cytokinesis. PLoS One. 2:e409 10.1371/journal.pone.0000409 - DOI - PMC - PubMed
    1. Burkard M.E., Randall C.L., Larochelle S., Zhang C., Shokat K.M., Fisher R.P., Jallepalli P.V. 2007. Chemical genetics reveals the requirement for Polo-like kinase 1 activity in positioning RhoA and triggering cytokinesis in human cells. Proc. Natl. Acad. Sci. USA. 104:4383–4388 10.1073/pnas.0701140104 - DOI - PMC - PubMed
    1. Burkard M.E., Maciejowski J., Rodriguez-Bravo V., Repka M., Lowery D.M., Clauser K.R., Zhang C., Shokat K.M., Carr S.A., Yaffe M.B., Jallepalli P.V. 2009. Plk1 self-organization and priming phosphorylation of HsCYK-4 at the spindle midzone regulate the onset of division in human cells. PLoS Biol. 7:e1000111 10.1371/journal.pbio.1000111 - DOI - PMC - PubMed

Publication types

MeSH terms