. 2010 Nov 15;191(4):861-74.
doi: 10.1083/jcb.201006102.

Cytoskeletal mechanics of proplatelet maturation and platelet release

Affiliations

Cytoskeletal mechanics of proplatelet maturation and platelet release

Jonathan N Thon et al. J Cell Biol. .

Abstract

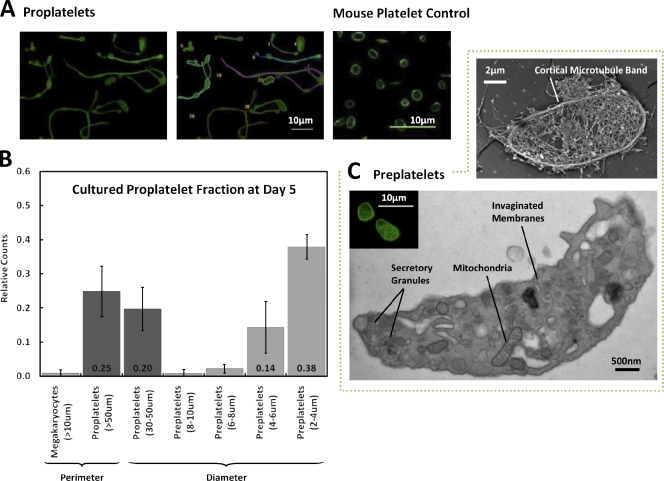
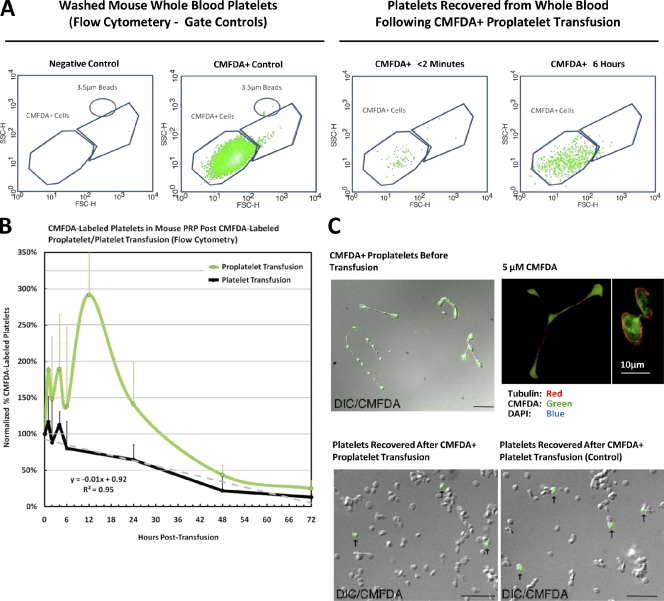
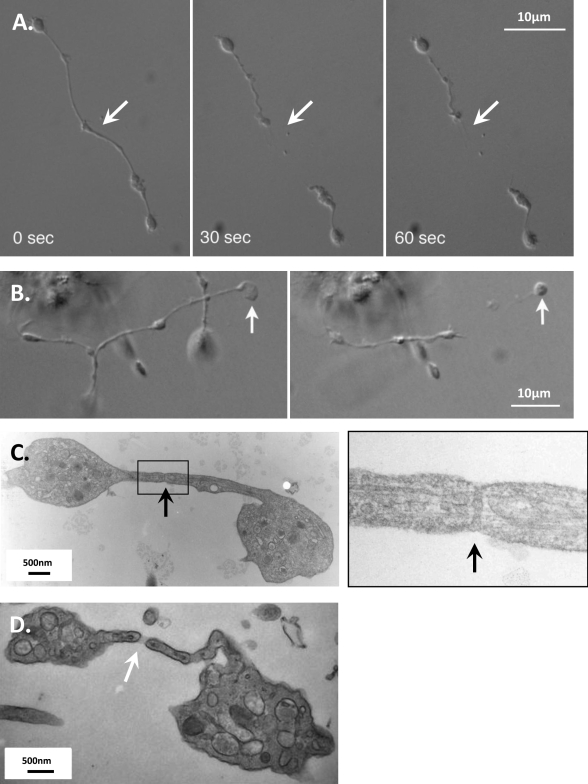
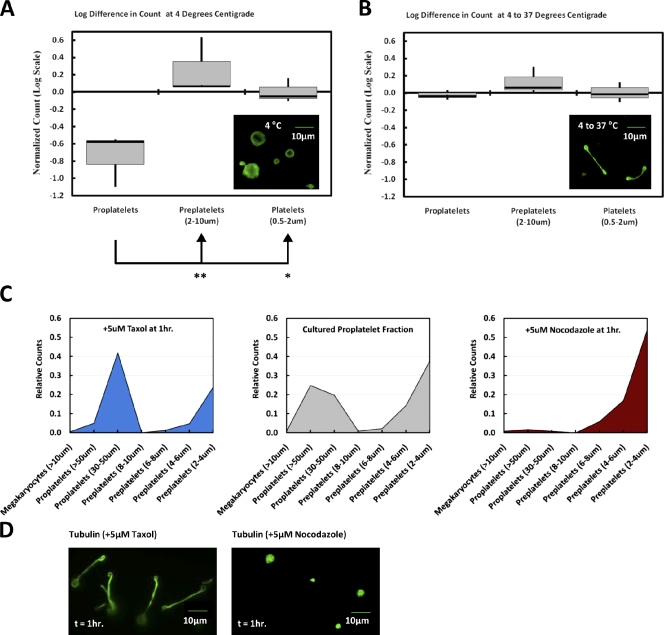
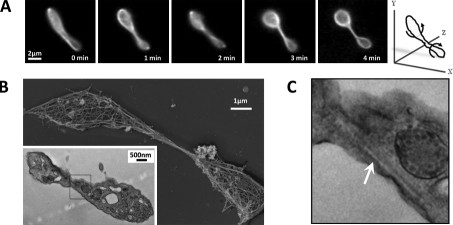
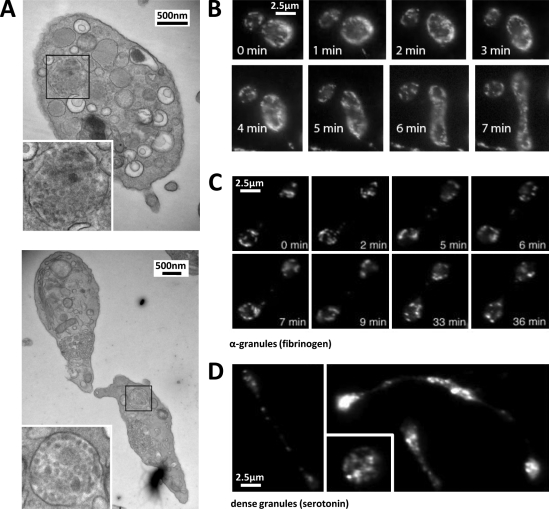
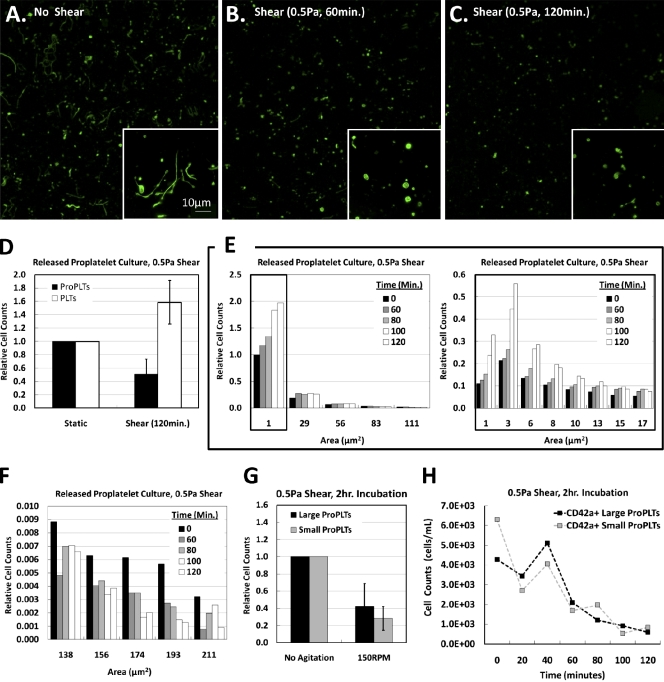
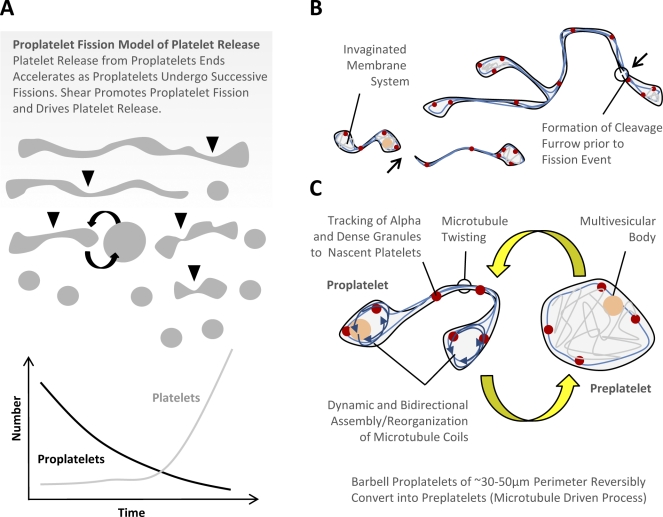
Megakaryocytes generate platelets by remodeling their cytoplasm into long proplatelet extensions, which serve as assembly lines for platelet production. Although the mechanics of proplatelet elongation have been studied, the terminal steps of proplatelet maturation and platelet release remain poorly understood. To elucidate this process, released proplatelets were isolated, and their conversion into individual platelets was assessed. This enabled us to (a) define and quantify the different stages in platelet maturation, (b) identify a new intermediate stage in platelet production, the preplatelet, (c) delineate the cytoskeletal mechanics involved in preplatelet/proplatelet interconversion, and (d) model proplatelet fission and platelet release. Preplatelets are anucleate discoid particles 2-10 µm across that have the capacity to convert reversibly into elongated proplatelets by twisting microtubule-based forces that can be visualized in proplatelets expressing GFP-β1-tubulin. The release of platelets from the ends of proplatelets occurs at an increasing rate in time during culture, as larger proplatelets undergo successive fission, and is potentiated by shear.


Figures

Figure 1.
Figure 1.
Identification and quantification of intermediates in platelet release by immunofluorescence microscopy. The released proplatelet-enriched fraction and washed mouse platelets (control) were probed with a rabbit polyclonal antibody against detyrosinated tubulin and analyzed by immunofluorescence microscopy for different-sized objects. Intermediates in platelet release were categorized based on perimeter (proplatelets) or diameter (megakaryocytes, preplatelets, and platelets). (A) Representative pictures of a day 5 proplatelet-enriched culture before (left) and after (middle) thresholding of anti-tubulin–labeled intermediates using MetaMorph software and washed mouse platelets (0.5–2-µm diameter; right). (B) Relative distribution of intermediates at day 5 of culture after proplatelet enrichment. (C) Representative pictures of the tubulin cytoskeleton of mouse preplatelets (2–10-µm diameter; immunofluorescence microscopy; inset), their ultrastructure (thin-section EM; bottom), and cytoskeleton (rapid-freeze EM; top).
Figure 2.
Figure 2.
Released proplatelets mature into multiple individual platelets in vivo. (A) Washed mouse whole blood platelets were run directly on the flow cytometer (negative control) or labeled with 5 µM CMFDA before analysis (CMFDA+ control). The CMFDA+ mouse whole blood platelet population was used to establish forward/side scatter and fluorescent intensity parameters used to identify newly released platelets. Released proplatelets from mouse fetal liver cell culture were labeled with 5 µM CMFDA and transfused into live mice. PRP was collected immediately after transfusion (CMFDA+ <2 min) and 6 h after transfusion (CMFDA+ 6 h), and analyzed by flow cytometry. CMFDA+ platelets were identified using the aforementioned gates. CMFDA-labeled platelet counts were comparable at <2 min after transfusion in CMFDA-labeled platelet and cultured proplatelet transfused mice (≥1% platelet recovery and ≥0.1% of circulating platelets). (B) CMFDA-labeled proplatelets were transfused into mice, and whole blood samples were collected via retro-orbital bleeding at regular intervals over a period of 72 h, commencing with a <2-min time point. PRP was isolated, and platelets were analyzed by flow cytometry and immunofluorescence microscopy. (C) Representative pictures of CMFDA-labeled proplatelets before transfusion and mouse PRP after CMFDA-labeled proplatelet and platelet transfusions. Fluorescence and DIC images were overlaid and merged. Arrows indicate CMFDA-labeled platelets recovered from recipient mice 2 h after transfusion, demonstrating maturation of released proplatelets into multiple individual platelets within the circulatory system. Released PPs were also stained for tubulin (red) and DAPI (blue) to confirm CMFDA labeling of proplatelets before transfusion. CMFDA fluoresces at 458 nm and is shown in green. Immunofluorescence images are exhibited as a montage of representative cells from the same sample slide. Error bars indicate mean ± standard deviation.
Figure 3.
Figure 3.
Direct visualization of proplatelet/platelet release in culture. (A and B) Isolated proplatelets were diluted with a semisolid culture medium and maintained in custom BSA-coated chambers at 37°C. They were examined on an inverted microscope, and frames were captured at 30-s intervals. (A) The separation of proplatelet cytoplasm and associated release of a shorter proplatelet fragment. The arrows highlight the site of proplatelet division. (B) The release of an individual platelet (arrows) from the end of a larger released proplatelet. (C and D) Thin-section electron micrographs showing the ultrastructure of a barbell-shaped proplatelet in the process of platelet release. Black arrows highlight the formation of a constricted region resembling a cleavage furrow along the long shaft of a cultured proplatelet. (C, inset) A higher magnification view of the boxed area is shown. (D) A similarly shaped barbell proplatelet immediately after cleavage. The arrow highlights the site of proplatelet division.
Figure 4.
Figure 4.
Preplatelets reversibly convert into proplatelets using microtubule-based forces. (A and B) Proplatelet-enriched fractions were probed with a rabbit polyclonal antibody against detyrosinated tubulin and analyzed by immunofluorescence microscopy for different-sized objects. Samples were incubated at 37°C (normal control), 4°C for 1 h, or 4°C for 1 h and returned to 37°C for 1 h. All values were normalized to the 37°C controls. (A) Depolymerization of tubulin at 4°C shifted the proplatelet population into preplatelet forms. *, P < 0.05; **, P < 0.01. Arrows indicate values compared and significance level of difference. (B) The proplatelet population returned to normal upon repolymerization of tubulin at 37°C. Data were subject to one-way ANOVA for three independent samples and Tukey HSD analysis. (C) Released proplatelet/platelet fraction from second gradient sedimentation probed with a rabbit polyclonal antibody against detyrosinated tubulin and analyzed by immunofluorescence microscopy for different-sized objects. Distribution of proplatelet and preplatelet forms after 1 h in culture with 5 µM taxol (promotes microtubule polymerization; left), a vector control (middle), or 5 µM nocodazole (promotes microtubule depolymerization; right). Microtubule stabilization and depolymerization shifted the population toward proplatelet and preplatelet forms, respectively. (D) Representative pictures of cultured intermediates after taxol (proplatelet) or nocodazole (preplatelet) incubations.
Figure 5.
Figure 5.
Microtubule dynamics during the conversion of preplatelets to barbell-proplatelets. (A) Fluorescent time-lapse microscopy of a released preplatelet isolated from megakaryocytes retrovirally directed to express GFP–β1-tubulin. The oval preplatelet microtubule marginal band is observed to twist about its center several times in a clockwise fashion over the course of 4 min to yield a barbell-shaped proplatelet with well-defined microtubule loops at each end. (B) Rapid-freeze and thin-section electron micrographs showing the cytoskeleton and ultrastructure of microtubules in proplatelets. (C) High magnification electron micrograph of the boxed region in B shows microtubules twisting about the proplatelet center to yield a “figure 8” structure.
Figure 6.
Figure 6.
Granules are synthesized, packaged, and continue to sort in released proplatelets. (A) High magnification electron micrographs show the presence of MVBs in released preplatelets (top) and proplatelets (bottom). (B and C) Mouse preplatelet/proplatelet labeled with a fluorescent human fibrinogen conjugate, which is taken up and stored in α-granules. The distribution and dynamics of the labeled α-granules were followed using time-lapse fluorescence microscopy and demonstrate ongoing, bidirectional α-granule movement during preplatelet to proplatelet conversion. (C) Red dots highlight α-granule movement toward the top end of the proplatelet, whereas green dots highlight movement toward the bottom end. Labeled organelles moved bidirectionally along the microtubule tracks of cytoplasmic bridges and cortices of developing proplatelets at a rate of ∼0.13–0.26 µm/min, implying continued organization of platelet contents through late stages of the maturation process. The width of the field is 10 µm. (D) Released proplatelet/platelet fraction from second gradient sedimentation probed with a rabbit monoclonal antibody against serotonin. Fluorescence and DIC images were overlaid and merged. Images are exhibited as a montage of representative cells from the same sample slide. Dense granules distribute evenly within the preplatelet and along the cytoplasmic bridges and bulbous tip of released proplatelets and continue to translocate throughout maturation.
Figure 7.
Figure 7.
Shear force promotes proplatelet fission and platelet release. (A–H) Proplatelets released from fetal liver–derived megakaryocytes were cultured for 2 h in the presence or absence of shear (∼0.5 Pa). Every 20 min, samples were removed and probed with a rabbit polyclonal antibody against β1-tubulin and analyzed by immunofluorescence microscopy for different-sized objects (A–D) or labeled with a CD42a-specifc, FITC-conjugated antibody and analyzed by flow cytometry (G and H). (A–C) Representative micrographs of the culture after 0 (A), 60 (B), and 120 (C) min of shear. (insets) High magnification views of the composite images are shown. (D) Compared with no shear controls, platelet numbers increased over time, whereas proplatelet numbers decreased (n = 4). (E and F) Representative quantification of culture intermediates under shear with time. Platelet and PP progeny (cells of area = 1–137 µm2; E) and proplatelet progenitors (138–227 µm2; F) were binned by size (area), and their relative counts over time were spread across multiple bins to resolve the mechanism of platelet release. The data describe an inverse relationship between smaller and larger object counts that reveal dynamic proplatelet fission and continuous platelet release under shear with time. (G) Flow cytometric analysis of cultured proplatelet intermediates under shear with time (n = 3). (H) Representative quantification of cultured proplatelet intermediates by flow cytometry. Samples support immunofluorescence microscopy data and reveal a significant decrease in the number of large proplatelets and PP intermediates (small ProPLTs) after 2 h relative to no shear control. Error bars indicate mean ± standard deviation.
Figure 8.
Figure 8.
Proplatelet fission model of platelet release. Model of platelet production suggested by these experiments and previous studies (see Results). (A) Released proplatelets undergo successive rounds of fission along their midbody and at their ends. This process is mediated by the formation of a cleavage furrow at the point of division and results in platelet release from proplatelet ends at an increasing rate in time as more ends become available after each fission event. Shear promotes proplatelet fission and drives platelet release. (B) Barbell proplatelets of ∼30–50-µm perimeter reversibly convert into preplatelets. This process is driven by twisting microtubule-based forces and may represent a novel mechanism of microtubule reorganization and granule redistribution after each fission event. (C) During barbell proplatelet formation, dynamic and bidirectional assembly and reorganization of microtubule coils mediate platelet cytoskeleton arrangement as α- and dense granules track to distal proplatelet tips. Platelets release from proplatelet ends after the final fission event.

Comment in

Similar articles

Cited by

References

    1. Baker G.R., Sullam P.M., Levin J. 1997. A simple, fluorescent method to internally label platelets suitable for physiological measurements. Am. J. Hematol. 56:17–25 10.1002/(SICI)1096-8652(199709)56:1<17::AID-AJH4>3.0.CO;2-5 - DOI - PubMed
    1. Becker R.P., De Bruyn P.P. 1976. The transmural passage of blood cells into myeloid sinusoids and the entry of platelets into the sinusoidal circulation; a scanning electron microscopic investigation. Am. J. Anat. 145:183–205 10.1002/aja.1001450204 - DOI - PubMed
    1. Behnke O. 1969. An electron microscope study of the rat megacaryocyte. II. Some aspects of platelet release and microtubules. J. Ultrastruct. Res. 26:111–129 10.1016/S0022-5320(69)90039-2 - DOI - PubMed
    1. Behnke O., Forer A. 1998. From megakaryocytes to platelets: platelet morphogenesis takes place in the bloodstream. Eur. J. Haematol. Suppl. 61:3–23 - PubMed
    1. Choi E.S., Nichol J.L., Hokom M.M., Hornkohl A.C., Hunt P. 1995. Platelets generated in vitro from proplatelet-displaying human megakaryocytes are functional. Blood. 85:402–413 - PubMed

Publication types