. 2010 Dec 27;90(12):1381-7.
doi: 10.1097/TP.0b013e3181ffbadd.

Urinary cell levels of mRNA for OX40, OX40L, PD-1, PD-L1, or PD-L2 and acute rejection of human renal allografts

Affiliations

Urinary cell levels of mRNA for OX40, OX40L, PD-1, PD-L1, or PD-L2 and acute rejection of human renal allografts

Cheguevara Afaneh et al. Transplantation. .

Abstract

Background: The positive costimulatory proteins OX40 and OX40L and negative regulatory proteins programmed death (PD)-1, PD ligand 1, and PD ligand 2 have emerged as significant regulators of acute rejection in experimental transplantation models.

Methods: We obtained 21 urine specimens from 21 renal allograft recipients with graft dysfunction and biopsy-confirmed acute rejection and 25 specimens from 25 recipients with stable graft function and normal biopsy results (stable). Urinary cell levels of mRNAs were measured using real-time quantitative polymerase chain reaction assays, and the levels were correlated with allograft status and outcomes.

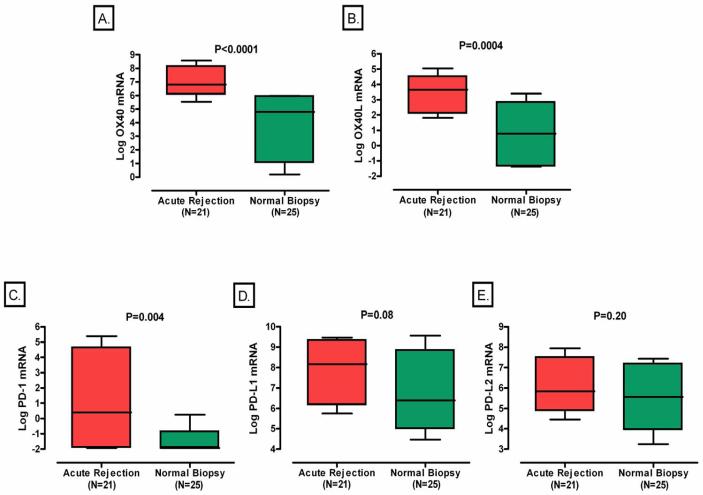
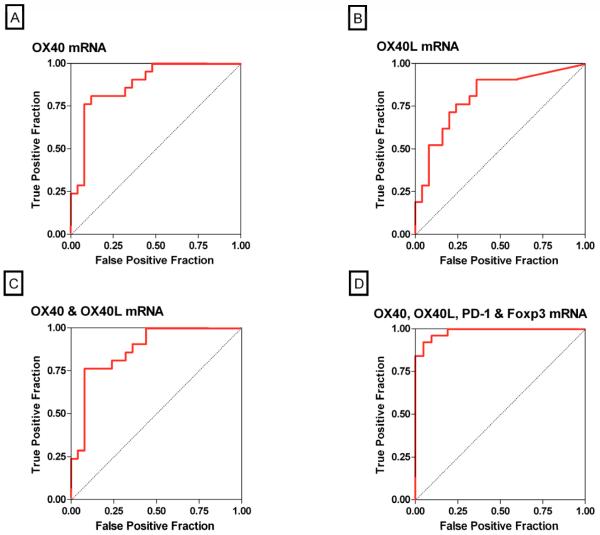
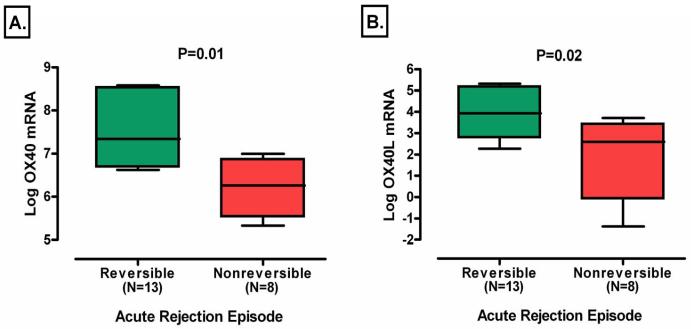
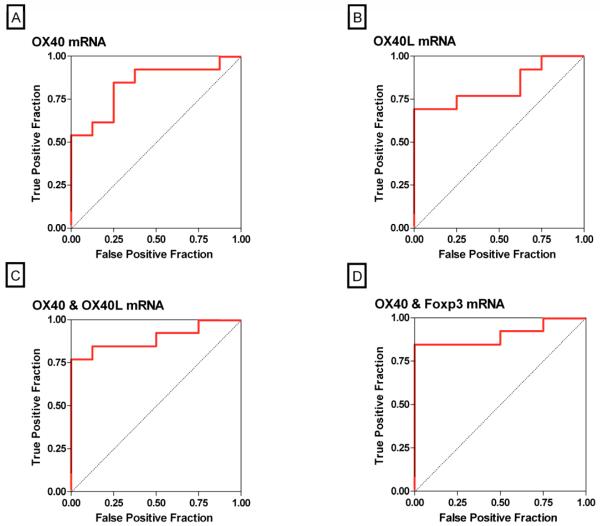
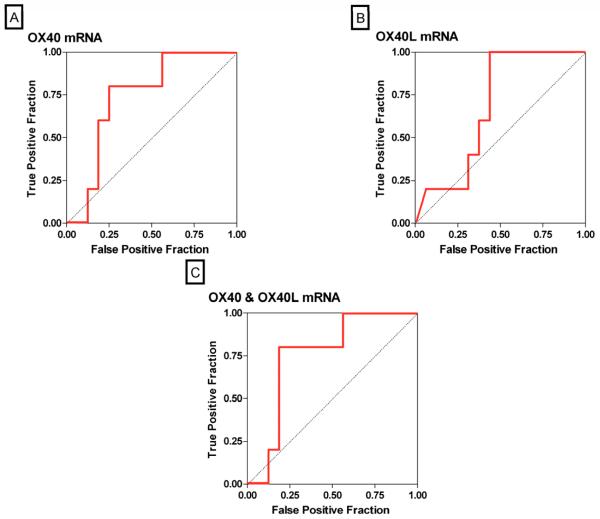
Results: Levels of OX40 mRNA (P<0.0001, Mann-Whitney test), OX40L mRNA (P=0.0004), and PD-1 mRNA (P=0.004), but not the mRNA levels of PD ligand 1 (P=0.08) or PD ligand 2 (P=0.20), were significantly higher in the urinary cells from the acute rejection group than the stable group. Receiver operating characteristic curve analysis demonstrated that acute rejection is predicted with a sensitivity of 95% and a specificity of 92% (area under the curve=0.98, 95% confidence interval 0.96-1.0, P<0.0001) using a combination of levels of mRNA for OX40, OX40L, PD-1, and levels of mRNA for the previously identified biomarker Foxp3. Within the acute rejection group, levels of mRNA for OX40 (P=0.0002), OX40L (P=0.0004), and Foxp3 (P=0.04) predicted acute rejection reversal, whereas only OX40 mRNA levels (P=0.04) predicted graft loss after acute rejection.

Conclusion: A linear combination of urinary cell levels of mRNA for OX40, OX40L, PD-1, and Foxp3 was a strong predictor of acute rejection in human renal allograft biopsies. This prediction model should be validated using an independent cohort of renal allograft recipients.


Figures

Figure 1
Figure 1. Levels of mRNA in Urinary Cells
Boxplots show the 10th, 25th, 50th, 75th, and 90th percentiles of log-transformed 18S-normalized mRNA levels for OX40, OX40L, PD-1, PD-L1, or PD-L2 in urine samples obtained from 21 subjects with graft dysfunction and biopsy-proven acute rejection and 25 subjects with stable graft function and normal biopsy results. The levels of mRNA for OX40 (Panel A), OX40L (Panel B) and PD-1 (Panel C), but not the levels of mRNA for PD-L1 (panel D) or PD-L2 (panel E) were significantly higher in urinary cells from subjects with acute rejection (Acute Rejection) than in the subjects with stable graft function and normal biopsy results (Normal Biopsy). Two-tailed P-values are based on Mann-Whitney test. In all cases, the natural log transformed values of 18S-normalized mRNA levels are shown.
Figure 2
Figure 2. Receiver-Operating-Characteristic Curves of mRNA Levels for Predicting Acute Rejection
The fraction of true positive results (sensitivity) and false positive results (1-specificity) for levels of mRNA, each normalized for 18S rRNA, are displayed as predictors of acute rejection. The calculated area under the curve (AUC) was 0.88 (95 percent confidence interval, 0.78 to 0.98) for OX40 mRNA levels (P<0.0001, Panel A), 0.81 (95 percent confidence interval, 0.68 to 0.94) for OX40L mRNA levels (P<0.0001, Panel B), 0.87 (95 percent confidence interval, 0.77 to 0.98) for the best linear combination of OX40 and OX40L (P<0.0001, Panel C) and 0.98 (95 percent confidence interval, 0.96 to 1.0) for the best linear combination of levels of OX40, OX40L, PD-1 and Foxp3 (P<0.0001, Panel D). An AUC value of 0.5 is considered no better than predicted by chance (null hypothesis), while a value of 1.0 is considered a perfect test.
Figure 3
Figure 3. Levels of mRNA in Urinary Cells in Subjects with Reversible or Nonreversible Acute Rejection
Successful reversal of acute rejection was defined as a return in creatinine to within 15 percent of baseline within 4 weeks of initiating anti-rejection treatment (16), and 13 of the 21 acute rejections qualified as reversed using this criterion. Boxplots show the 10th, 25th, 50th, 75th, and 90th percentiles of log-transformed 18S-normalized mRNA levels for OX40 and OX40L, in urine samples obtained from the 13 subjects with a return in creatinine to within 15 percent of baseline within 4 weeks of initiating anti-rejection treatment (Reversible) and the 8 subjects without a return in creatinine to within 15 percent of baseline within 4 weeks of initiating anti-rejection treatment (Nonreversible). The levels of mRNA for OX40 (Panel A) and OX40L (Panel B) were significantly higher in urinary cells from subjects with reversible acute rejection than in the subjects with nonreversible acute rejection. Two-tailed P-values are based on Mann-Whitney test. In all cases, the natural log transformed values of 18S-normalized mRNA levels are shown.
Figure 4
Figure 4. Receiver-Operating-Characteristic Curves of mRNA Levels for Predicting Acute Rejection Reversibility
The fraction of true positive results (sensitivity) and false positive results (1-specificity) for levels of mRNA, each normalized for 18S rRNA, are displayed as predictors of reversal of acute rejection. The calculated area under the curve was 0.84 (95 percent confidence interval, 0.66 to 1.0) for OX40 mRNA levels (P=0.0002, Panel A), 0.83 (95 percent confidence interval, 0.65 to 1.0) for OX40L mRNA levels (P=0.0004, Panel B), 0.89 (95 percent confidence interval, 0.75 to 1.0) for the best linear combination of levels of mRNA for OX40 and OX40L (P<0.0001, Panel C) and 0.90 (95 percent confidence interval, 0.77 to 1.0) for the best linear combination of levels of mRNA for OX40 and Foxp3 (P<0.0001, Panel D). A value of 0.5 is considered no better than predicted by chance and a value of 1.0 is considered a perfect indicator.
Figure 5
Figure 5. Receiver-Operating-Characteristic Curves of mRNA Levels for Predicting Graft Loss
The fraction of true positive results (sensitivity) and false positive results (1-specificity) for levels of mRNA, each normalized for 18S rRNA, are displayed as predictors of graft loss within 6 months of biopsy proven acute rejection. The calculated area under the curve was 0.74 (95 percent confidence interval, 0.51 to 0.97) for OX40 mRNA levels (P=0.04, Panel A), 0.68 (95 percent confidence interval, 0.44 to 0.92) for OX40L mRNA levels (P=0.14, Panel B), 0.75 (95 percent confidence interval, 0.52 to 0.98) for the best linear combination of levels of mRNA for OX40 and OX40L (P=0.04, Panel C). A value of 0.5 is considered no better than predicted by chance and a value of 1.0 is considered a perfect indicator.

References

    1. Hariharan S, Johnson CP, Bresnahan BA, Taranto SE, McIntosh MJ, Stablein D. Improved graft survival after renal transplantation in the United States, 1988 to 1996. N Engl J Med. 2000;342(9):605. - PubMed
    1. Bustami RT, Ojo AO, Wolfe RA, et al. Immunosuppression and the risk of post-transplant malignancy among cadaveric first kidney transplant recipients. Am J Transplant. 2004;4(1):87. - PubMed
    1. Jamil B, Nicholls K, Becker GJ, Walker RG. Impact of acute rejection therapy on infections and malignancies in renal transplant recipients. Transplantation. 1999;68(10):1597–603. - PubMed
    1. Cornell LD, Smith RN, Colvin RB. Kidney transplantation: mechanisms of rejection and acceptance. Annu Rev Pathol. 2008;3:189. - PubMed
    1. Rothstein DM, Sayegh MH. T-cell costimulatory pathways in allograft rejection and tolerance. Immunol Rev. 2003;196:85. - PubMed

Publication types

MeSH terms