Review
. 2011 Mar;91(3):363-78.
doi: 10.1038/labinvest.2010.187. Epub 2010 Nov 15.

Isolation of alveolar epithelial type II progenitor cells from adult human lungs

Affiliations
Free PMC article
Review

Isolation of alveolar epithelial type II progenitor cells from adult human lungs

Naoya Fujino et al. Lab Invest. 2011 Mar.
Free PMC article

Abstract

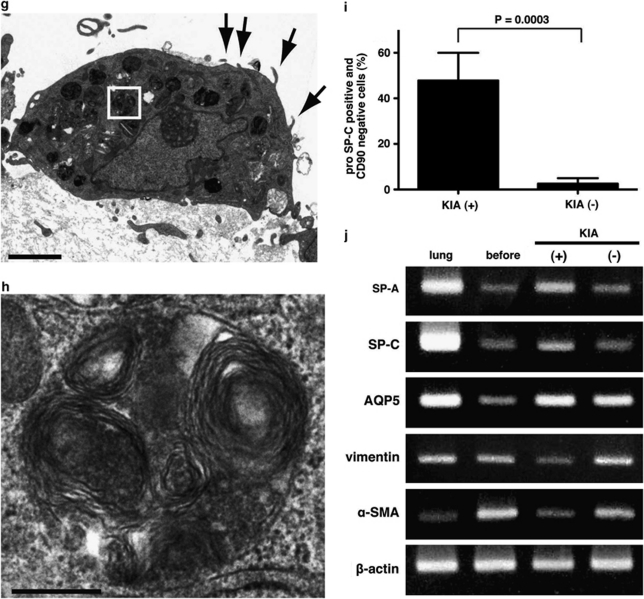
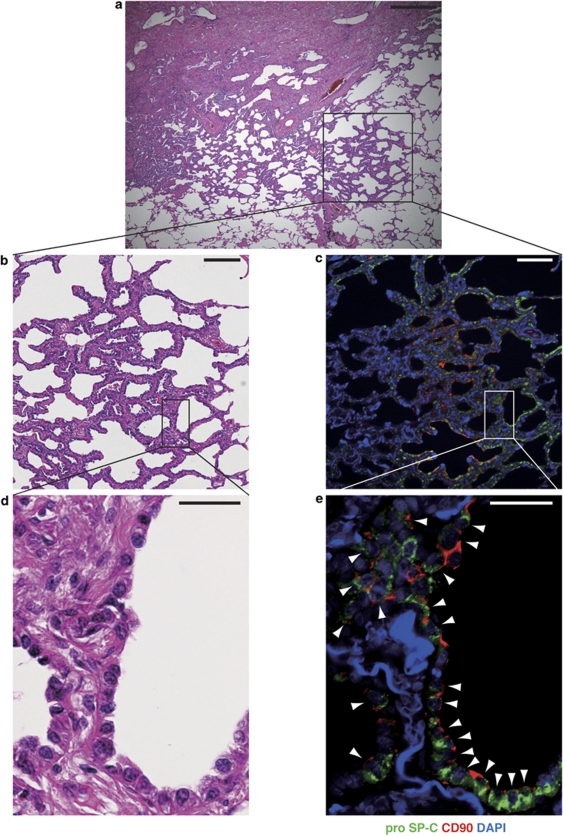
Resident stem/progenitor cells in the lung are important for tissue homeostasis and repair. However, a progenitor population for alveolar type II (ATII) cells in adult human lungs has not been identified. The aim of this study is to isolate progenitor cells from adult human lungs with the ability to differentiate into ATII cells. We isolated colony-forming cells that had the capability for self-renewal and the potential to generate ATII cells in vitro. These undifferentiated progenitor cells expressed surface markers of mesenchymal stem cells (MSCs) and surfactant proteins associated with ATII cells, such as CD90 and pro-surfactant protein-C (pro-SP-C), respectively. Microarray analyses indicated that transcripts associated with lung development were enriched in the pro-SP-C(+)/CD90(+) cells compared with bone marrow-MSCs. Furthermore, pathological evaluation indicated that pro-SP-C and CD90 double-positive cells were present within alveolar walls in normal lungs, and significantly increased in ATII cell hyperplasias contributing to alveolar epithelial repair in damaged lungs. Our findings demonstrated that adult human lungs contain a progenitor population for ATII cells. This study is a first step toward better understanding of stem cell biology in adult human lung alveoli.


Figures

Figure 1
Figure 1
Morphology and protein expression of colony-forming cells derived from adult human lungs. Representative images of a colony generated from CD45 lung cells (a) and expanded spindle-shaped cells at passage 5 (b). (c) Representative immunophenotypes of the expanded cells at passage 4–6. These cells expressed mesenchymal stem cell (MSC) markers (CD73, CD90, and CD105) but not known endogenous stem cell markers (c-kit and CD133). Hematopoietic/endothelial markers (CD45, CD34, CD31, and VEGF receptor 2 (VEGFR2)) were not expressed. E-cadherin (an epithelial marker) was negative. (d) Flow cytometric analysis of pro-surfactant protein-C (pro-SP-C; an alveolar type II (ATII) cell marker) and CD90 (an MSC marker) in the expanded cells (left panel) and primary CD45 lung cells (right panel). The expanded cells from the colony-forming cells expressed CD90 with low expression of pro-SP-C. Primary CD45 lung cells were used for controls of pro-SP-C and CD90 staining. (e) Immunofluorescence staining of pro-SP-C (green) and CD90 (red) in the expanded cells (left panel) and CD45 lung cells (right panel). The expanded cells cultured on a chamber slide were fixed and stained. Primary CD45 lung cells were cytospun for immunostaining. ATII cells expressed pro-SP-C, but not CD90 (arrow). Arrowhead indicates cells expressing CD90 alone. Insets show isotype controls. (fh) Immunofluorescence staining for SP-A (f; an ATII cell marker; green), SP-D (g; an ATII cell marker; green) and vimentin (h; a mesenchymal marker; green) in the expanded cells that were cytospun. Flow cytometric analyses and immunofluorescence staining were performed for samples from three different patients. Scale bars: (a, b) 200 μm; (e) 50 μm; (fh) 10 μm.
Figure 1
Figure 1
Morphology and protein expression of colony-forming cells derived from adult human lungs. Representative images of a colony generated from CD45 lung cells (a) and expanded spindle-shaped cells at passage 5 (b). (c) Representative immunophenotypes of the expanded cells at passage 4–6. These cells expressed mesenchymal stem cell (MSC) markers (CD73, CD90, and CD105) but not known endogenous stem cell markers (c-kit and CD133). Hematopoietic/endothelial markers (CD45, CD34, CD31, and VEGF receptor 2 (VEGFR2)) were not expressed. E-cadherin (an epithelial marker) was negative. (d) Flow cytometric analysis of pro-surfactant protein-C (pro-SP-C; an alveolar type II (ATII) cell marker) and CD90 (an MSC marker) in the expanded cells (left panel) and primary CD45 lung cells (right panel). The expanded cells from the colony-forming cells expressed CD90 with low expression of pro-SP-C. Primary CD45 lung cells were used for controls of pro-SP-C and CD90 staining. (e) Immunofluorescence staining of pro-SP-C (green) and CD90 (red) in the expanded cells (left panel) and CD45 lung cells (right panel). The expanded cells cultured on a chamber slide were fixed and stained. Primary CD45 lung cells were cytospun for immunostaining. ATII cells expressed pro-SP-C, but not CD90 (arrow). Arrowhead indicates cells expressing CD90 alone. Insets show isotype controls. (fh) Immunofluorescence staining for SP-A (f; an ATII cell marker; green), SP-D (g; an ATII cell marker; green) and vimentin (h; a mesenchymal marker; green) in the expanded cells that were cytospun. Flow cytometric analyses and immunofluorescence staining were performed for samples from three different patients. Scale bars: (a, b) 200 μm; (e) 50 μm; (fh) 10 μm.
Figure 2
Figure 2
The pro-SP-C+/CD90+ cells have the ability of self-renew and mesodermal differentiation. (a) Representative images of proliferating cells and a secondary colony from a single cell. (b) Frequency of clonogenic cells in each patient. Limiting dilution analysis revealed that the minimum frequency of clonogenic cells in each patient was 17.1±9.2% (mean±s.d., n=6). The mean and s.d. of the frequencies are shown as crossbars. (c) Flow cytometric analyses for CD73, CD90, CD105, and pro-SP-C in pre-sorted cells (pre-sorted) and clonogenic cells (clone). Isotype controls were shown in gray. (d) Semiquantitative RT–PCR for SP-B, SP-C, vimentin, and α-smooth muscle actin (α-SMA) in pre-sorted cells and two batches of clonogenic cells (clones 1 and 2). Whole lung is used for positive control (lung) and RNA sample from whole lung without reverse transcriptase reaction is used for negative control (no-RT). (e) Representative images of adipogenic and osteogenic differentiation of the pro-SP-C+/CD90+ cells. Fatty acid binding protein 4 (FABP4)-positive cells indicated mature adipocytes (left upper panel, orange) and oil red O staining showed lipid deposition (right upper panel, red) in adipogenic differentiation. Osteocalcin-positive cells were osteoblasts (left lower panel, red) and alizarin S staining demonstrated calcium deposition (right lower panel, red) in osteogenic differentiation. Scale bars: (a) 100 μm and (e) 50 μm.
Figure 3
Figure 3
Comparison of transcription profiles between pro-SP-C+/CD90+ cells and bone marrow-mesenchymal stem cells (BM-MSCs). (a) The area-proportional Venn diagram presenting the overlap between transcripts expressed in pro-SP-C+/CD90+ cells (blue) and BM-MSCs (red). (b) Functional annotation clustering in specifically expressed gene sets in pro-SP-C+/CD90+ cells (blue) or BM-MSCs (red). Original array data are available at http://www.ncbi.nlm.nih.gov/geo/query/acc.cgi?token=zpapfyaqumsqmvw&acc=GSE21095. (c) Semiquantitative RT–PCR for eight genes identified through the microarray analysis. Forkhead box f1 (Foxf1), T-box 4 (Tbx4), FBJ murine osteosarcoma viral oncogene homolog B (FosB), and laminin α5, that were selected out of the annotations of ‘transcription' and/or ‘lung development', were highly expressed by pro-SP-C+/CD90+ cells. At the same time, distal-less homeobox 5 (DLX5), N-cadherin, homeobox C10 (HOXC10), and hyaluronan synthase 1 (HAS1), that were chosen from the annotation of ‘skeletal system development' or ‘cell adhesion', were highly expressed by BM-MSCs. Three bathes of pro-SP-C+/CD90+ cells and three batches of BM-MSCs were examined. β-Actin was used as an endogenous control. In RT–PCR for Foxf1, Tbx4, FosB, laminin α5, and β-actin, a representative negative control (pro-SP-C+/CD90+ cells batch1 without reverse transcriptase reaction) is shown as no-RT. In RT–PCR for DLX5, N-cadherin, HOXC10, and HAS1, a representative negative control (BM-MSCs batch1 without reverse transcriptase reaction) is shown as no-RT.
Figure 4
Figure 4
The pro-SP-C+/CD90+ cells differentiate into ATII cells in vitro. (af) Representative morphologic appearances of cells cultured on a mixture of Matrigel and rat tail collagen with keratinocyte growth factor (KGF), cAMP, and IBMX (KIA(+), left side panels) and without any additives (KIA(−), right side panels) in phase contrast images (a, b) and hematoxylin–eosin (HE) staining (c, d) and immunofluorescence staining of pro-SP-C (green) and CD90 (red) (e, f). White arrowheads indicate pro-SP-C+/CD90 cells (ATII cells) and white arrows show SP-C/CD90+ cells (e, f). A pro-SP-C+/CD90+ cell was still observed (yellow arrowhead in e). Unidentified differentiated cells expressing neither pro-SP-C nor CD90 were seen (yellow arrows in e, f). (g, h) Transmission electron microscopic images of differentiated cells in KIA(+) group. (g) Lamellar bodies (a white-framed rectangle) and apical microvilli (arrows) were observed as distinctive structures in ATII cells. (h) A higher magnification of lamellar bodies from a white-framed rectangle in (g). (i) The ratio of the number pro-SP-C+/CD90 cells to the number of DAPI-stained nuclei was significantly higher in the KIA(+) group than that in the KIA(−) group (47.8±12.2% vs 2.5±2.5%, n=4 in each, P=0.0003). (j) Representative RT–PCR analysis of SP-A, SP-C (ATII cell markers) and aquaporin 5 (AQP5; an ATI cell marker) and vimentin and α-SMA (mesenchymal markers) before and after differentiation. Scale bars: (a, b) 200 μm; (c, d) 50 μm; (e, f) 20 μm; (g) 2 μm; (h) 300 nm.
Figure 4
Figure 4
The pro-SP-C+/CD90+ cells differentiate into ATII cells in vitro. (af) Representative morphologic appearances of cells cultured on a mixture of Matrigel and rat tail collagen with keratinocyte growth factor (KGF), cAMP, and IBMX (KIA(+), left side panels) and without any additives (KIA(−), right side panels) in phase contrast images (a, b) and hematoxylin–eosin (HE) staining (c, d) and immunofluorescence staining of pro-SP-C (green) and CD90 (red) (e, f). White arrowheads indicate pro-SP-C+/CD90 cells (ATII cells) and white arrows show SP-C/CD90+ cells (e, f). A pro-SP-C+/CD90+ cell was still observed (yellow arrowhead in e). Unidentified differentiated cells expressing neither pro-SP-C nor CD90 were seen (yellow arrows in e, f). (g, h) Transmission electron microscopic images of differentiated cells in KIA(+) group. (g) Lamellar bodies (a white-framed rectangle) and apical microvilli (arrows) were observed as distinctive structures in ATII cells. (h) A higher magnification of lamellar bodies from a white-framed rectangle in (g). (i) The ratio of the number pro-SP-C+/CD90 cells to the number of DAPI-stained nuclei was significantly higher in the KIA(+) group than that in the KIA(−) group (47.8±12.2% vs 2.5±2.5%, n=4 in each, P=0.0003). (j) Representative RT–PCR analysis of SP-A, SP-C (ATII cell markers) and aquaporin 5 (AQP5; an ATI cell marker) and vimentin and α-SMA (mesenchymal markers) before and after differentiation. Scale bars: (a, b) 200 μm; (c, d) 50 μm; (e, f) 20 μm; (g) 2 μm; (h) 300 nm.
Figure 5
Figure 5
Localization of pro-SP-C+/CD90+ cells in normal lung (a, b) and damaged lung (cf). (a) Immunofluorescence staining for pro-SP-C (green) and CD90 (red) in normal alveoli. Arrowhead shows a pro-SP-C+/CD90+ cell. The pro-SP-C/CD90+ cell was a pericyte in the alveolar wall (arrow)., (b) A confocal image from a white-framed rectangle in (a). (c, e) Low magnified images from the lung tissues from a patient with idiopathic pulmonary fibrosis (IPF). (c, e) are serial sectioned images. V, pulmonary vein. (c) HE staining showed that patchy fibrosis with remodeling of lung structure in a subpleura region. (e) Immunofluorescence staining for pro-SP-C (green) and CD90 (red) in specimen correlating to the area in (c). Positive immunostaining for CD90 (red, arrows) was observed in the wall of vascular structures (V), as previously reported. (d, f) Higher magnification of hyperplasia of ATII cells from the boxes in (c, e). Double-positive cells (arrowheads) for pro-SP-C (green) and CD90 (red) were seen within ATII cell hyperplasia that are thought to contribute to alveolar epithelial regeneration. ATII cells (arrows) are located around the pro-SP-C+/CD90+ cells. (g) The ratio of pro-SP-C+/CD90+ cells to CD45 lung cells significantly increased in fibrotic lungs (1.23±0.13%, n=3) compared with normal lungs (0.32±0.06%, n=3, P=0.0003). Data show mean±s.d. Scale bars: (a) 50 μm; (b) 10 μm; (c, e) 200 μm; (d, f) 50 μm.
Figure 5
Figure 5
Localization of pro-SP-C+/CD90+ cells in normal lung (a, b) and damaged lung (cf). (a) Immunofluorescence staining for pro-SP-C (green) and CD90 (red) in normal alveoli. Arrowhead shows a pro-SP-C+/CD90+ cell. The pro-SP-C/CD90+ cell was a pericyte in the alveolar wall (arrow)., (b) A confocal image from a white-framed rectangle in (a). (c, e) Low magnified images from the lung tissues from a patient with idiopathic pulmonary fibrosis (IPF). (c, e) are serial sectioned images. V, pulmonary vein. (c) HE staining showed that patchy fibrosis with remodeling of lung structure in a subpleura region. (e) Immunofluorescence staining for pro-SP-C (green) and CD90 (red) in specimen correlating to the area in (c). Positive immunostaining for CD90 (red, arrows) was observed in the wall of vascular structures (V), as previously reported. (d, f) Higher magnification of hyperplasia of ATII cells from the boxes in (c, e). Double-positive cells (arrowheads) for pro-SP-C (green) and CD90 (red) were seen within ATII cell hyperplasia that are thought to contribute to alveolar epithelial regeneration. ATII cells (arrows) are located around the pro-SP-C+/CD90+ cells. (g) The ratio of pro-SP-C+/CD90+ cells to CD45 lung cells significantly increased in fibrotic lungs (1.23±0.13%, n=3) compared with normal lungs (0.32±0.06%, n=3, P=0.0003). Data show mean±s.d. Scale bars: (a) 50 μm; (b) 10 μm; (c, e) 200 μm; (d, f) 50 μm.
Figure 6
Figure 6
Representative histological analysis of lung tissues derived from an adenocarcinoma patient: HE staining (a, b, d) and immunofluorescence staining for pro-SP-C and CD90 (c, e). Images in (b, c) and (d, e) are shown from mirror sections, respectively. (a) A lower magnification of lung adenocarcinoma. (b, c) Higher magnifications from (a). Well-differentiated adenocarcinoma in (b) showed expression of pro-SP-C (green) and CD90 (red) in (c). (d, e) Higher magnifications from (b, c). Cancer cells that showed severe atypical nuclei and clear nucleoli in (d) expressed both pro-SP-C and CD90 in (e, arrowheads). Scale bars: (ac) 400 μm (d, e) 50 μm.

Similar articles

Cited by

References

    1. Liu X, Engelhardt JF. The glandular stem/progenitor cell niche in airway development and repair. Proc Am Thorac Soc. 2008;5:682–688. - PMC - PubMed
    1. Hackett TL, Shaheen F, Johnson A, et al. Characterization of side population cells from human airway epithelium. Stem Cells. 2008;26:2576–2585. - PMC - PubMed
    1. Giangreco A, Arwert EN, Rosewell IR, et al. Stem cells are dispensable for lung homeostasis but restore airways after injury. Proc Natl Acad Sci USA. 2009;106:9286–9291. - PMC - PubMed
    1. Rock JR, Onaitis MW, Rawlins EL, et al. Basal cells as stem cells of the mouse trachea and human airway epithelium. Proc Natl Acad Sci USA. 2009;106:12771–12775. - PMC - PubMed
    1. Rawlins EL, Okubo T, Xue Y, et al. The role of Scgb1a1+ Clara cells in the long-term maintenance and repair of lung airway, but not alveolar, epithelium. Cell Stem Cell. 2009;4:525–534. - PMC - PubMed

Publication types

MeSH terms