

Infectious disease modeling of social contagion in networks
- PMID: 21079667
- PMCID: PMC2973808
- DOI: 10.1371/journal.pcbi.1000968
Infectious disease modeling of social contagion in networks
Abstract
Many behavioral phenomena have been found to spread interpersonally through social networks, in a manner similar to infectious diseases. An important difference between social contagion and traditional infectious diseases, however, is that behavioral phenomena can be acquired by non-social mechanisms as well as through social transmission. We introduce a novel theoretical framework for studying these phenomena (the SISa model) by adapting a classic disease model to include the possibility for 'automatic' (or 'spontaneous') non-social infection. We provide an example of the use of this framework by examining the spread of obesity in the Framingham Heart Study Network. The interaction assumptions of the model are validated using longitudinal network transmission data. We find that the current rate of becoming obese is 2 per year and increases by 0.5 percentage points for each obese social contact. The rate of recovering from obesity is 4 per year, and does not depend on the number of non-obese contacts. The model predicts a long-term obesity prevalence of approximately 42, and can be used to evaluate the effect of different interventions on steady-state obesity. Model predictions quantitatively reproduce the actual historical time course for the prevalence of obesity. We find that since the 1970s, the rate of recovery from obesity has remained relatively constant, while the rates of both spontaneous infection and transmission have steadily increased over time. This suggests that the obesity epidemic may be driven by increasing rates of becoming obese, both spontaneously and transmissively, rather than by decreasing rates of losing weight. A key feature of the SISa model is its ability to characterize the relative importance of social transmission by quantitatively comparing rates of spontaneous versus contagious infection. It provides a theoretical framework for studying the interpersonal spread of any state that may also arise spontaneously, such as emotions, behaviors, health states, ideas or diseases with reservoirs.
Conflict of interest statement
The authors have declared that no competing interests exist.
Figures
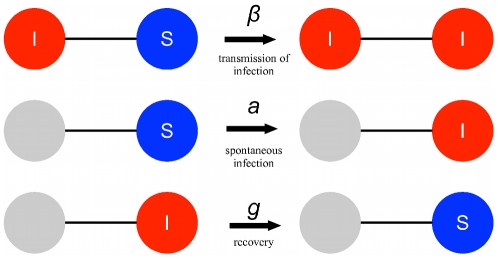
 . (ii) A susceptible individual spontaneously becomes infected at rate
  , regardless of the state of their contacts. (iii) An infected individual returns to being susceptible at rate
  , independent of the state of their contacts.
 = 0.64 (the ratio of triangles to triples).
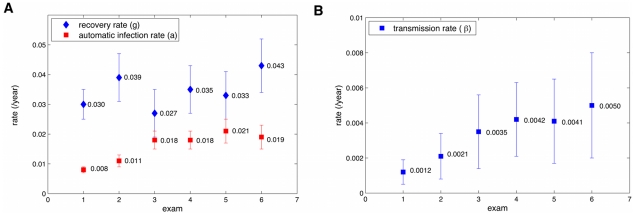
 confidence intervals on measurements from regression of transition probability versus number of contacts of a certain type. (A) Contact-independent rates. The rate of recovery (
 ) appears to be constant within the margins of error throughout the study while the rate of automatic infection (
 ) appears to increase between exams 1 and 3, then stay constant. (B) The contact-dependent transmission rate (
 ) appears to increase over time.
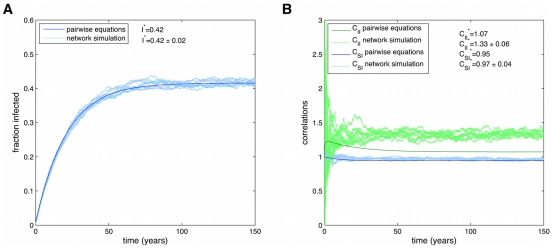
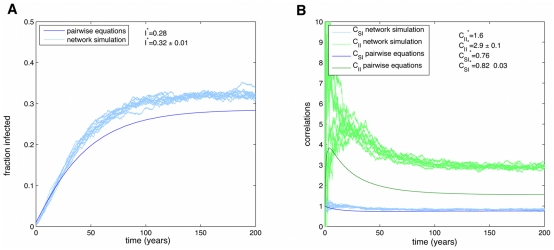
 . In the SISa model there is a co-existence of susceptible and infected individuals at steady state. For these parameters there is a good agreement with simulations and the pair-wise equations for the fraction infected (A), but the equations predict less correlations (B), due to the neglect of heterogeneities in the number of contacts.
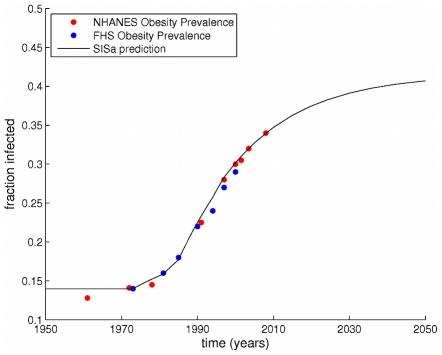
 and
and  to vary as observed in Figure 4, but kept
  constant at its average value. Before 1970 (when our measurements started), the prevalence of obesity was assumed to be stable at 14
 . The model and the data both show very similar rates of increase, with a slow post-1970 increase, followed by a rapid increase, and then increasing more slowly. The SISa model predicts the prevalence of obesity will increase slowly to a peak at 42
 .
.
 .
.
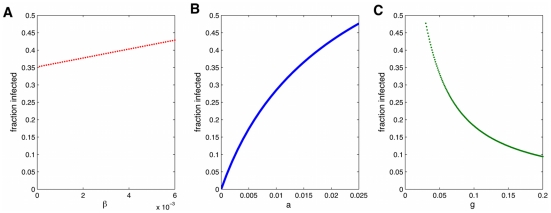
 is larger than that observed for the spread of obesity, the pair-wise equations diverge more from the full simulations, both for the fraction infected (A) and the correlations (B).
  .
.
 :(B),
:(B),  :(C),
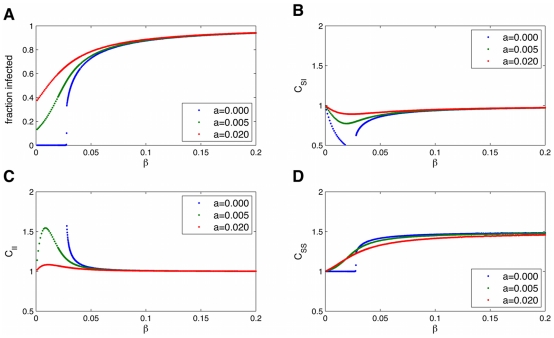
:(C),  :(D)) on the rate of transmission,
  . When
  , expected in most social infections, there is no longer a threshold (
 ) needed for the infection to invade the population. The network causes infected individuals to cluster
  away from susceptible individuals
  , and this is more pronounced for larger
  and lower fraction infected. Parameters are
  .
.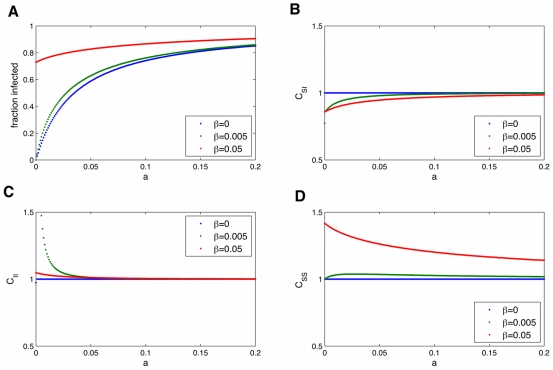
 :(B),
:(B),  :(C),
:(C),  :(D)) on the rate of automatic infection,
  . Parameters are
  .
.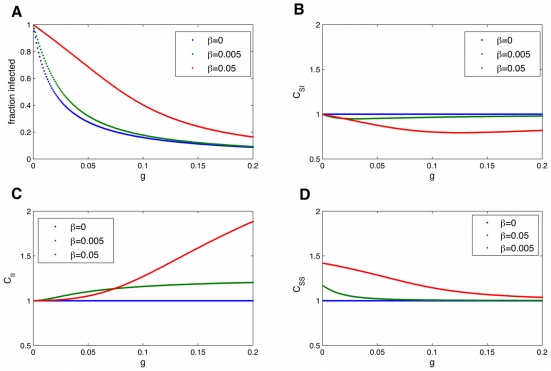
 :(B),
:(B),  :(C),
:(C),  :(D)) on the rate of recovery from infection,
  . Parameters are
  .
.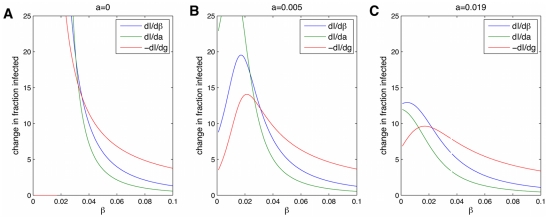
 is better for small
  and changing
  is best for larger
  . For intermediate
  , changing
  is best. Parameters are
  .
.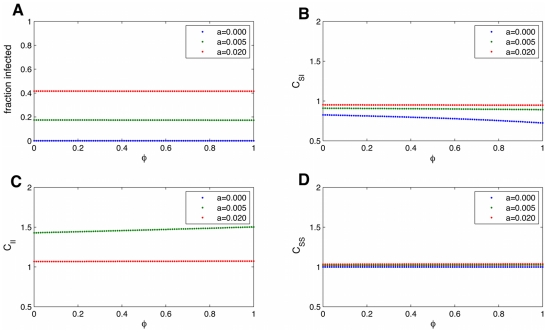
 :(B),
:(B),  :(C),
:(C),  :(D)) measured from the pair-wise equations on the network transitivity,
  . For the parameters measured for the transmission of obesity, shown here, there is no strong dependence on
  . Hence for studying the obesity epidemic it is justified to ignore
  to simplify calculations. Parameters are
  .
.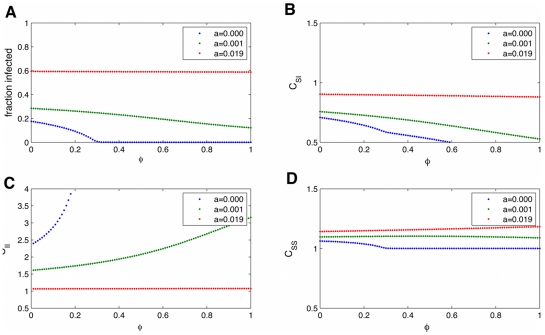
 :(B),
:(B),  :(C),
:(C),  :(D)) measured from the pair-wise equations on the network transitivity,
  . For larger
  ,
,  slightly decreases the fraction infected by leading to more spatial correlation of infected individuals. Parameters are
  .
.References
-
- Jackson MO. Social and Economic Networks. Princeton University Press; 2008.
-
- Watts DJ. The “New” science of networks. Annu Rev Sociol. 2004;30:243–270.
-
- Luke DA, Harris JK. Network analysis in public health: History, methods, and applications. Annu Rev Public Health. 2007;28:69–93. - PubMed
-
- West JD, Bergstrom T, Bergstrom CT. The eigenfactor metrics: A network approach to assessing scholarly journals. College and Research Libraries. 2010 In Press.
Publication types
MeSH terms
Grants and funding
LinkOut - more resources
Full Text Sources
Medical
