. 2010 Nov 4;6(11):e1001186.
doi: 10.1371/journal.pgen.1001186.

Genetic basis of growth adaptation of Escherichia coli after deletion of pgi, a major metabolic gene

Affiliations

Genetic basis of growth adaptation of Escherichia coli after deletion of pgi, a major metabolic gene

Pep Charusanti et al. PLoS Genet. .

Abstract

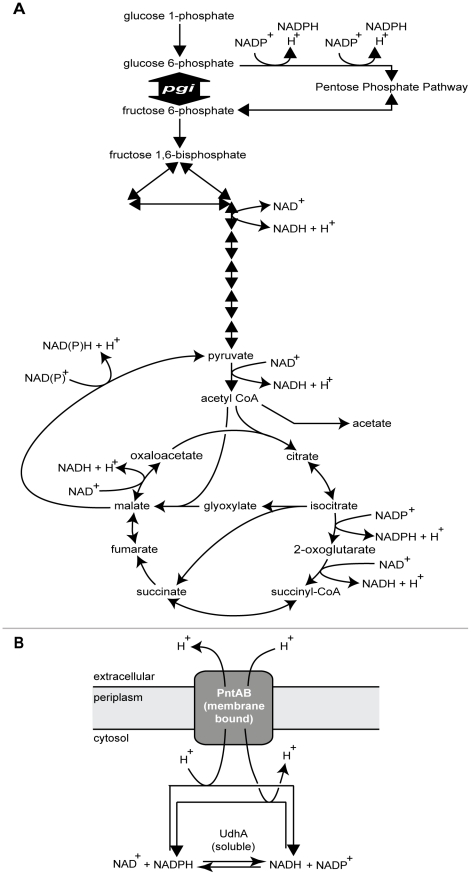
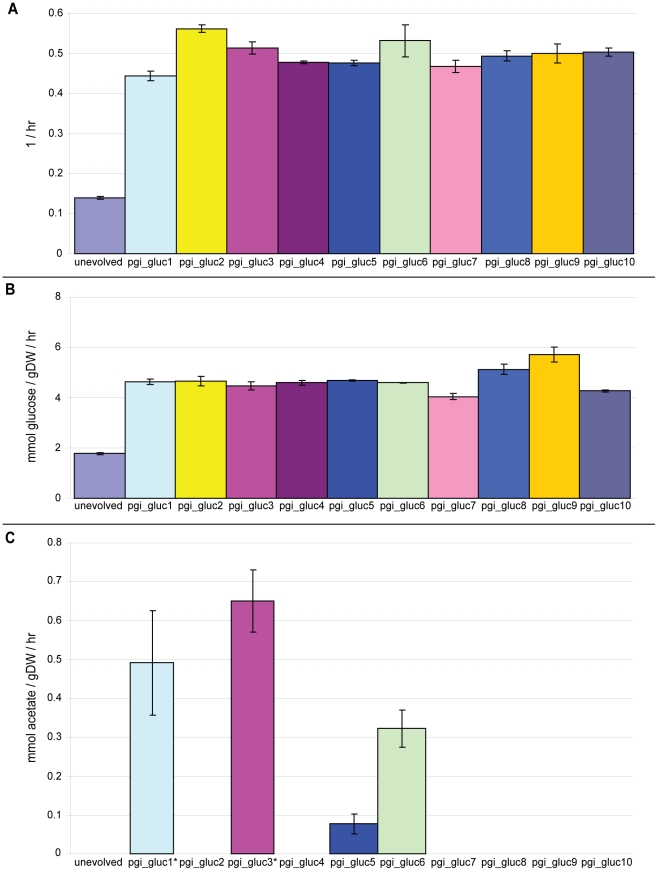
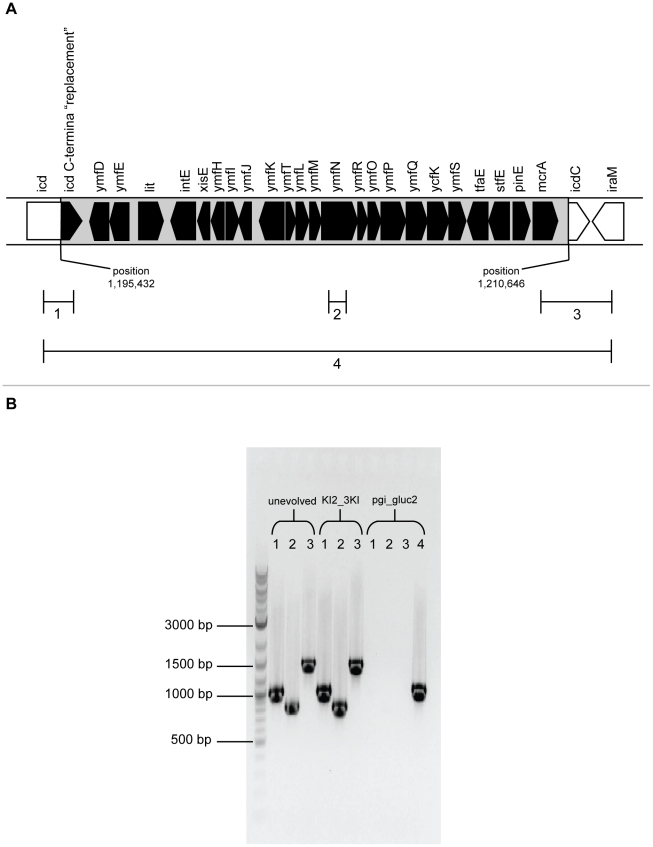
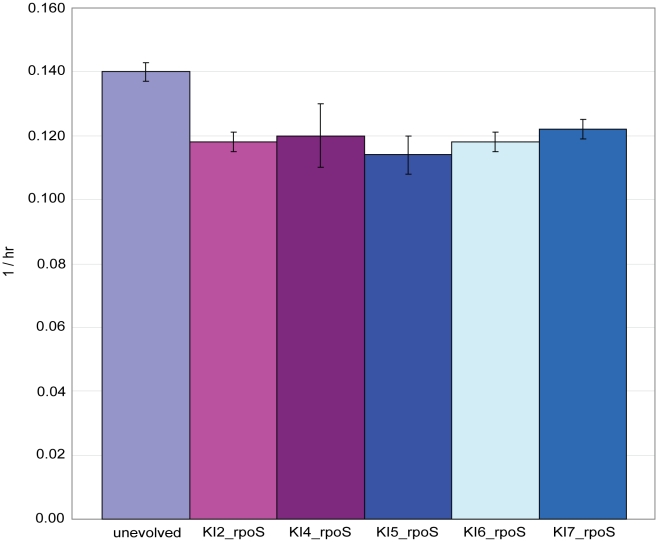
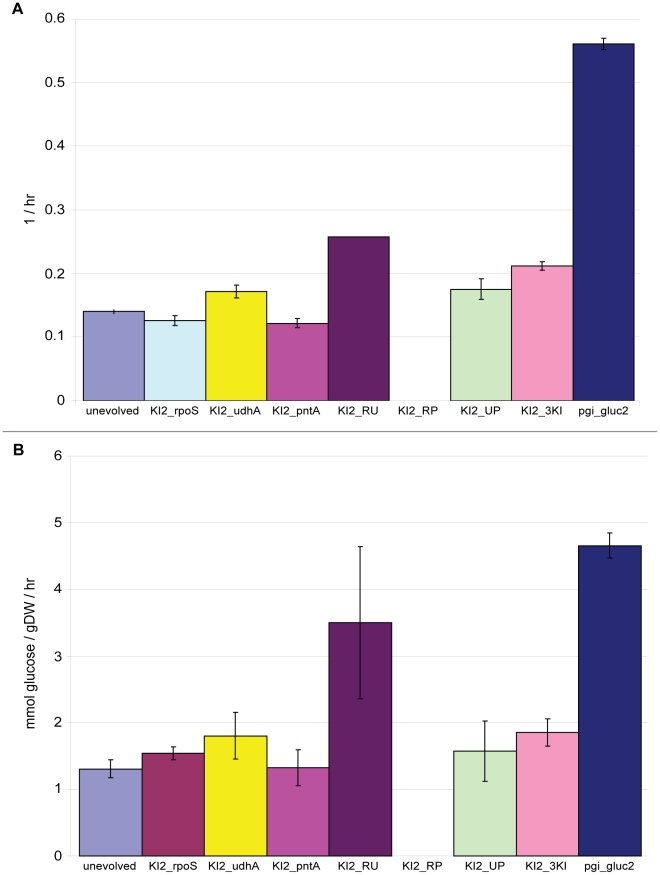
Bacterial survival requires adaptation to different environmental perturbations such as exposure to antibiotics, changes in temperature or oxygen levels, DNA damage, and alternative nutrient sources. During adaptation, bacteria often develop beneficial mutations that confer increased fitness in the new environment. Adaptation to the loss of a major non-essential gene product that cripples growth, however, has not been studied at the whole-genome level. We investigated the ability of Escherichia coli K-12 MG1655 to overcome the loss of phosphoglucose isomerase (pgi) by adaptively evolving ten replicates of E. coli lacking pgi for 50 days in glucose M9 minimal medium and by characterizing endpoint clones through whole-genome re-sequencing and phenotype profiling. We found that 1) the growth rates for all ten endpoint clones increased approximately 3-fold over the 50-day period; 2) two to five mutations arose during adaptation, most frequently in the NADH/NADPH transhydrogenases udhA and pntAB and in the stress-associated sigma factor rpoS; and 3) despite similar growth rates, at least three distinct endpoint phenotypes developed as defined by different rates of acetate and formate secretion. These results demonstrate that E. coli can adapt to the loss of a major metabolic gene product with only a handful of mutations and that adaptation can result in multiple, alternative phenotypes.


Conflict of interest statement

The authors have declared that no competing interests exist.

Figures

Figure 1
Figure 1. Role of pgi, udhA, and pntAB in cellular metabolism.
A. The gene pgi catalyzes the isomerization of glucose 6-phosphate to fructose 6-phosphate in upper glycolysis. Removal of this gene forces glycolytic flux through the pentose phosphate pathway, creating a redox imbalance due to excess NADPH production. B. The genes udhA and pntAB catalyze the interconversion of NAD/NADH and NADP/NADPH. UdhA is a soluble protein whereas PntAB is membrane-bound.
Figure 2
Figure 2. Growth rates, glucose uptake rates, and acetate secretion rates for unevolved and all evolved strains.
A. Growth rates for the starting unevolved Δpgi strain and all ten evolved strains after adaptive evolution. The growth rate of unevolved and 50-day evolved wild-type E. coli K12 MG1655 in the same medium was 0.69(0.0069 and 0.79(0.0092 hr-1. B. Glucose uptake rates for the unevolved (pgi strain and the ten evolved strains after adaptive evolution. Unevolved and 50-day evolved wild-type E. coli had a glucose uptake rate of 8.43(0.72 and 11.6(0.41 mmol/gDW/hour, respectively. C. Acetate secretion rates for the unevolved (pgi strain and the ten evolved strains after adaptive evolution. Unevolved and 50-day evolved wild-type E. coli had an acetate secretion rate of 12.8(8.87 and 5.61(0.24 mmol/gDW/hour, respectively. The symbol * indicates strains that also secrete formate (pgi_gluc1: 0.49(0.13 mmol/gDW/hour; pgi_gluc3: 0.22(0.02 mmol/gDW/hour). All error bars represent the standard deviation from three biological replicates. Abbreviations – gDW: gram dry weight; hr: hour.
Figure 3
Figure 3. Loss of e14 prophage in pgi_gluc2.
A. Structure and location of the e14 prophage. It is integrated within the icd gene in the E. coli chromosome at position 1,195,432 to position 1,210,646. B. PCR analysis of the unevolved (pgi, pgi_gluc2 triple knock-in (KI2_3KI) and evolved pgi_gluc2 strains confirms loss of the e14 prophage in pgi_gluc2. Numbers 1 through 4 correspond to PCR amplification regions as indicated in the top panel. Regions 1 and 3 both span terminal segments of the integrated prophage and adjacent chromosomal DNA. Region 2 spans a segment wholly within the prophage. Region 4 spans the integration site and is amplified using the left primer from Region 1 and the right primer from Region 3.
Figure 4
Figure 4. Growth rates for five rpoS knock-in strains.
The strains were constructed by introducing five of the six rpoS mutations detected after adaptive evolution back into the starting unevolved Δpgi strain through site-directed mutagenesis. A similar knock-in strain containing the pgi_gluc3 rpoS mutation was not constructed. Growth rate data for the starting unevolved Δpgi strain is also shown for comparison. Error bars represent the standard deviation from three biological replicates. A full description for the strain abbreviations can be found in Table 1. Abbreviations – hr: hour.
Figure 5
Figure 5. Growth rates and glucose uptake rates for pgi_gluc2 single, double, and triple knock-in strains.
A. Growth rates for the three single, three double and triple knock-in strains constructed based on the three mutations that appeared in pgi_gluc2. The growth rates for the starting unevolved Δpgi strain and the evolved pgi_gluc2 strain are also shown for comparison. B. Corresponding glucose uptake rates for the seven knock-in strains. Data for the unevolved and evolved strains are again shown for comparison. Error bars for both represent the standard deviation from three biological replicates. A full description for the strain abbreviations can be found in Table 1. Abbreviations – gDW: gram dry weight; hr: hour.

References

    1. Herring CD, Raghunathan A, Honisch C, Patel T, Applebee MK, et al. Comparative genome sequencing of Escherichia coli allows observation of bacterial evolution on a laboratory timescale. Nat Genet. 2006;38:1406–1412. - PubMed
    1. Barrick JE, Yu DS, Yoon SH, Jeong H, Oh TK, et al. Genome evolution and adaptation in a long-term experiment with Escherichia coli. Nature. 2009;461:1243–1247. - PubMed
    1. Barrick JE, Lenski RE. Genome-wide Mutational Diversity in an Evolving Population of Escherichia coli. Cold Spring Harb Symp Quant Biol. 2009. - PMC - PubMed
    1. Conrad TM, Joyce AR, Applebee MK, Barrett CL, Xie B, et al. Whole-genome resequencing of Escherichia coli K-12 MG1655 undergoing short-term laboratory evolution in lactate minimal media reveals flexible selection of adaptive mutations. Genome Biol. 2009;10:R118. - PMC - PubMed
    1. Lee DH, Palsson BO. Adaptive Evolution Of Escherichia coli K-12 MG1655 On A Non-Native Carbon Source, L-1,2-Propanediol. Appl Environ Microbiol. - PMC - PubMed

Publication types

MeSH terms

LinkOut - more resources