. 2010 Nov 4;6(11):e1001192.
doi: 10.1371/journal.pgen.1001192.

Human-specific evolution and adaptation led to major qualitative differences in the variable receptors of human and chimpanzee natural killer cells

Affiliations

Human-specific evolution and adaptation led to major qualitative differences in the variable receptors of human and chimpanzee natural killer cells

Laurent Abi-Rached et al. PLoS Genet. .

Abstract

Natural killer (NK) cells serve essential functions in immunity and reproduction. Diversifying these functions within individuals and populations are rapidly-evolving interactions between highly polymorphic major histocompatibility complex (MHC) class I ligands and variable NK cell receptors. Specific to simian primates is the family of Killer cell Immunoglobulin-like Receptors (KIR), which recognize MHC class I and associate with a range of human diseases. Because KIR have considerable species-specificity and are lacking from common animal models, we performed extensive comparison of the systems of KIR and MHC class I interaction in humans and chimpanzees. Although of similar complexity, they differ in genomic organization, gene content, and diversification mechanisms, mainly because of human-specific specialization in the KIR that recognizes the C1 and C2 epitopes of MHC-B and -C. Humans uniquely focused KIR recognition on MHC-C, while losing C1-bearing MHC-B. Reversing this trend, C1-bearing HLA-B46 was recently driven to unprecedented high frequency in Southeast Asia. Chimpanzees have a variety of ancient, avid, and predominantly inhibitory receptors, whereas human receptors are fewer, recently evolved, and combine avid inhibitory receptors with attenuated activating receptors. These differences accompany human-specific evolution of the A and B haplotypes that are under balancing selection and differentially function in defense and reproduction. Our study shows how the qualitative differences that distinguish the human and chimpanzee systems of KIR and MHC class I predominantly derive from adaptations on the human line in response to selective pressures placed on human NK cells by the competing needs of defense and reproduction.


Conflict of interest statement

The authors have declared that no competing interests exist.

Figures
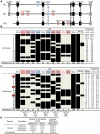
Figure 1
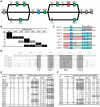
Figure 1. Chimpanzee and human KIR genotypes are comparably diverse.
(A) Shows KIR gene content of three chimpanzee haplotypes. Arrows indicate equivalent genes; dotted arrows, divergent alleles. Lineage III KIR are colored blue (MHC-C1 specific) or pink (MHC-C2 specific); names of activating KIR are red. Ψ, KIR pseudogene. Haplotype names are from panel (C). The flanking non-KIR genes are colored gray. (B) KIR gene content was assessed in 39 chimpanzees. The 16 distinct genotypes characterized and their frequencies are given here. Thirteen KIR loci defined by analysis of cDNA and of the three haplotype sequences of panel A were investigated. KIR phenotype and genotype frequencies are also given for the subgroup of 26 unrelated individuals. (C) Component KIR haplotypes were deduced from the genotype data presented in panel B, and presented here with their estimated frequencies. KIR gene and haplotype frequencies are also given for the subgroup of 26 unrelated individuals. ‘Genes’ gives the number of KIR per haplotype (‘All’), and the number of activating receptor genes (‘Act’). Chimpanzee KIR haplotype diversity stems from recombination involving five pairs of variable KIR: for each pair the top percentage indicates the observed ‘pairing frequency’ (genes both present or both absent) and the bottom percentage is the expected ‘pairing frequency’ under random distribution. *, significant linkage disequilibrium (p<0.001). Red boxes denote the sequenced haplotypes. (D) Both in number and gene content difference, chimpanzee KIR genotypes are within the human range (see Materials and Methods for details). CI, confidence interval.
Figure 2
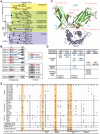
Figure 2. Human and chimpanzee KIR haplotypes differ in their organization and generation of diversity.
(A) Diversity in chimpanzee arises from the variable recombination of seven units in the centromeric region, whereas a similar number of human gene-content motifs is divided between the centromeric and telomeric regions. C1 or C2 specificity for each lineage III KIR is shown. Dotted lines indicate orthologs (between species) or alleles (within species). Ψ, KIR pseudogene. (A–B) KIR associated with A haplotypes are red; KIR associated with B haplotypes are blue. Chimpanzee KIR having no human strict ortholog are colored green. (B) Linkage to KIR2DL5 in human and chimpanzee. For each KIR an association ratio with 2DL5+/− haplotypes is given (for example KIR3DS1 is seven times more common on 2DL5A + haplotypes than on 2DL5A haplotypes); 2DS3/5 ratios are given in parenthesis to reflect an assumption (see Materials and Methods for details). Black boxes, reference gene for the linkage analysis (+, presence; −, absence). Ratios for framework KIR are shaded in gray. AL, absolute linkage. Linkage disequilibrium was assessed in chimpanzee and (*) indicates significance (p<0.001).
Figure 3
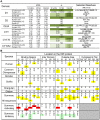
Figure 3. Reassorting inhibitory signaling and ligand-binding functions contributes to chimpanzee but not human KIR allelic diversity.
(A) Structural relationships between the three chimpanzee haplotypes. ‘Ig’ and ‘Tail’ refer to the exons encoding the immunoglobulin-like domains and the cytoplasmic tail, respectively. Colors for the genes are as in Figure 2. (B) Chimpanzee inhibitory KIR associate with different cytoplasmic tails on different haplotypes. Black boxes, combinations seen in genomic sequences; gray boxes, additional combinations seen in cDNA sequences (see Figure S13). (C) Mapping of the recombination points for the KIR genes with tails 1–3 and 7. Red arrows represent recombination breakpoints. Regions colored in green are equivalent (allelic) in the two genes. Blue denotes coding regions, gray the 3′UTR region, and yellow the immunoreceptor tyrosine-based inhibition motifs (ITIM). *, stop codon. (D) Sequence diversity of the seven groups of chimpanzee cytoplasmic tails. One sequence for each group is displayed. Human 2DL1 is used as the reference. Highlighted in gray are the two ITIM, the protein kinase C motif (PKC) and the casein kinase motif (CK) . (E–F) Chimpanzee (E) and human (F) KIR polymorphism. Domains contributing >50% of the variability are shaded in gray. Ind., estimate of the number of individuals sampled (‘+’, minimum number). Seq., number of nucleotide sequences. Prot., number of amino acid sequences. Chimpanzee sequences are given in Figure S14. Human KIR polymorphism was obtained from the IPD-KIR database .
Figure 4
Figure 4. Natural selection differentially diversified human and chimpanzee lineage III KIR.
(A) Phylogenetic analysis of lineage III KIR genomic sequences. The Bayesian tree topology is displayed and rooted with the gibbon sequence (blue arrow: midpoint root). Support is indicated for each node: Bayesian, maximum-likelihood, parsimony and neighbor-joining (top to bottom). Black squares: support is 100 with the four methods. *, support<50. (B) Lineage III KIR content in human and chimpanzee. Chimpanzee KIR are represented as a combination of Ig and tails with MHC specificity-determining residue 44 in the D1 domain in brackets. KIR are colored blue (MHC-C1 specific) or pink (MHC-C2 specific). Arrows indicates genomic (black) or cDNA (blue) Ig-Tail combinations (Figure 3B). (C) D1 and D2 positively selected positions (M8 p>0.95, Figure 5) are marked in red in the KIR2DL2-HLA-Cw3 three-dimensional structure (PDB file 1EFX represented). (D) KIR-MHC and KIR-KIR interactions for the selected residues: KIR2DL1-HLA-Cw4 (left); KIR2DL2-HLA-Cw3 (center), and KIRA-KIRB (right). Mutations at residues colored blue can disrupt KIR-HLA interaction , . In parenthesis is the number of residues to the nearest contact site. *, P8 is the eighth residue in the peptide bound by HLA-C. (E) Diversity in the cytoplasmic tails of inhibitory lineage III KIR. Positions with amino acid variation are represented (reference sequence is KIR2DL1). Orange highlight denotes positively selected position (M8 p>0.95) in one or more of three datasets comprising hominoid (‘All’), chimpanzee (‘Pt’) or human (‘Hsa’) sequences. Positions underlined correspond to the functional sites described in Figure 3D. *, only detected in the complete dataset (Figure 5).
Figure 5
Figure 5. Analysis of positive selection in the lineage III KIR.
(A) Likelihood ratio tests and detection of the D1, D2 and cytoplasmic tail (CYT) positions positively selected. Analysis was performed for all the hominoid sequences together and with just the human or chimpanzee or gorilla sequences; the number of sequences in each analysis is indicated in parentheses. For the cytoplasmic tail analyses all the sequences with an early termination (short tail KIR) were excluded. In addition, because of the risk of recombination between exon 7 and exon 8 (see Figure 3C) a reduced dataset was also created (CYT-R) where the nine amino acids encoded by exon 7 were discarded and the Pt-KIR2DL9 amino acids encoded by exon 8 were masked. Similarly, because the cytoplasmic tail of KIR2DL3*007 and the D2 domain of KIR2DL1*004 showed evidence of gene conversion, additional analyses were performed where these sequences were discarded: datasets CYT-R2 and D2-R, respectively. 2ΔL, two times the difference in likelihood between the models allowing for positive selection (M2a and M8) and the models that do not (null models: M1a, M7 and M8a). The significance level (α) is indicated when the null models were significantly rejected. NS, not significant. *: α∼0.01. When significant evidence of positive diversifying selection was obtained, the residues detected with model M8 were listed (underlined residues: p>0.95; boldened residues: p>0.99; **: p∼0.90). (B) Residues observed at the positively selected positions in the D1, D2 and CYT domains. Amino acids unique to one species are highlighted in yellow. In the summary section, amino acids only found on activating KIR are highlighted in red while those only found on inhibitory KIR are highlighted in green.
Figure 6
Figure 6. Emergence of MHC-C affected the functional interactions between MHC-B and lineage III KIR.
(A) Distribution of the hominoid MHC-B and -C residues that affect interaction with lineage III KIR. (B) Phylogenetic analysis of the MHC-B and -C sequences (α1–α3 domains). The maximum-likelihood tree topology was used for the display with PAML M0 branch lengths. The tree was rooted with MHC-E and support is given at nodes: Bayesian, maximum-likelihood, neighbor-joining and parsimony (top to bottom). *, support <95 (Bayesian) or <50 (parsimony). Ancestral residues were reconstructed for positions 76 and 80 and are given for five nodes where model M0 p>0.95 (residues underlined were obtained with model M2a; see Materials and Methods). Groups of sequences were collapsed to simplify display; Old World monkey MHC-B/C have similarities to both hominoid MHC-B and -C. (C) HLA-B allotypes with V76. AF, allele frequency. Populations with HLA-B*73 AF≥0.8% are listed; for HLA-B*46, populations were selected to represent the range of AF. Rec., recombination with HLA-C. PM, point mutation. N/A, not available. (D) Distribution of HLA-B*46 AF in Southeast Asia. White dots represent sample points.
Figure 7
Figure 7. MHC-B allotypes that acquire lineage III KIR-binding increase NK cell effector capacity.
(A) Summary of the KIR2DL/HLA-B (magenta) and KIR2DL/HLA-C (blue) interactions. (B) Average number of distinct KIR2DL-HLA interactions (ANDI) (top) and 2DL3PF*C1PF quantity (bottom; PF, phenotype frequency) in eight human population groups (see Materials and Methods; individual populations are in Figure S5). Area between the gapped lines is the 25–75 percentile range; area between the dotted lines (top part) is the non-outlier range (Whisker plot with 1.5 coefficient). Colors in the top part are as defined in (A). Population group in purple (bottom part) contains populations with HLA-B*46 phenotype frequency of 8.7–27.5%. (C) KIR-HLA phenotypic frequencies for five individual populations. Maximum: maximum ANDI assuming Hardy-Weinberg equilibrium. (D) Type I and type II functional divergence between MHC-B and -C α1–α2 domains. Positions characterized in this analysis are listed at the top of the panel, and black boxes indicate in which analysis these positions were characterized. ‘high’ refers to functional-divergence analyses while ‘low’ refers to an analysis to detect low functional divergence. MHC-B specific sites (indicated by a ‘B’) are defined as divergent in the MHC-B vs. MHC-C and MHC-B vs. Old World monkey-B/C comparisons but not in the MHC-C vs. Old World monkey-B/C comparison. The same approach was used for the MHC-C specific positions (indicated by a ‘C’). ‘All’, functionally-divergent in all pairwise comparisons. Underlined residues have better support (Figure S7). The gray box indicates residues that are in the recombinant region of HLA-B*46. Arrows indicate Peptide , TCR and KIR , contact sites.

References

    1. Lanier LL. Evolutionary struggles between NK cells and viruses. Nat Rev Immunol. 2008;8:259–268. - PMC - PubMed
    1. Diefenbach A, Raulet DH. The innate immune response to tumors and its role in the induction of T-cell immunity. Immunol Rev. 2002;188:9–21. - PubMed
    1. Moretta L, Ferlazzo G, Bottino C, Vitale M, Pende D, et al. Effector and regulatory events during natural killer-dendritic cell interactions. Immunol Rev. 2006;214:219–228. - PubMed
    1. Vivier E, Tomasello E, Baratin M, Walzer T, Ugolini S. Functions of natural killer cells. Nat Immunol. 2008;9:503–510. - PubMed
    1. Moffett-King A. Natural killer cells and pregnancy. Nat Rev Immunol. 2002;2:656–663. - PubMed

Publication types

MeSH terms