Comparative Study
. 2010 Nov 4;6(11):e1001177.
doi: 10.1371/journal.ppat.1001177.

HTLV-1 evades type I interferon antiviral signaling by inducing the suppressor of cytokine signaling 1 (SOCS1)

Affiliations
Comparative Study

HTLV-1 evades type I interferon antiviral signaling by inducing the suppressor of cytokine signaling 1 (SOCS1)

Stéphanie Olière et al. PLoS Pathog. .

Abstract

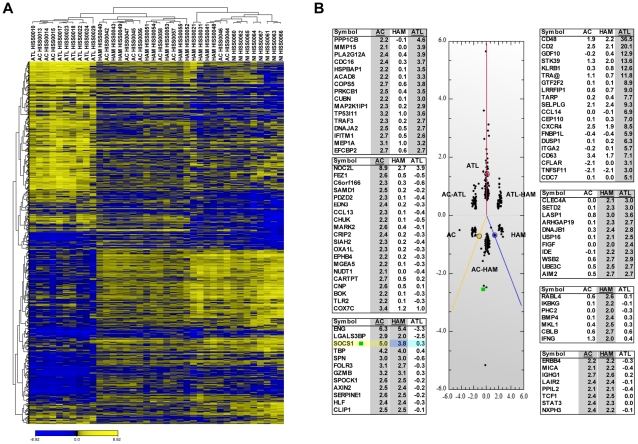
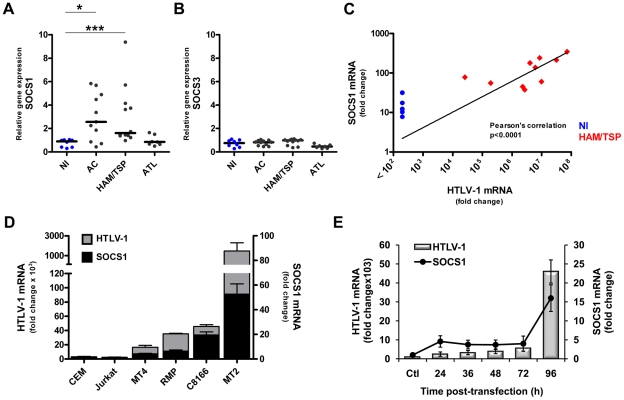
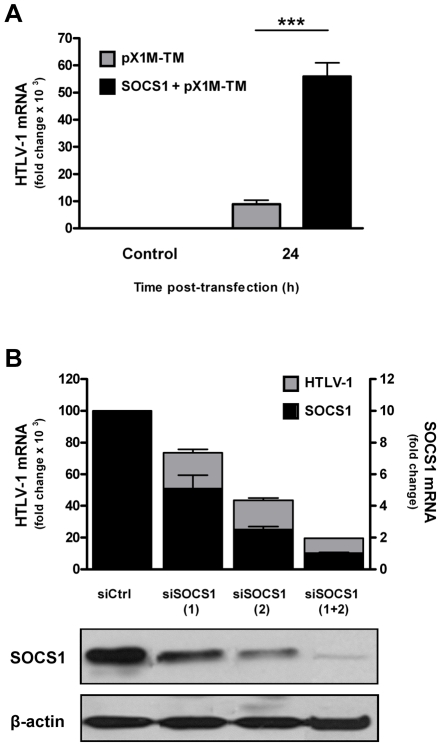
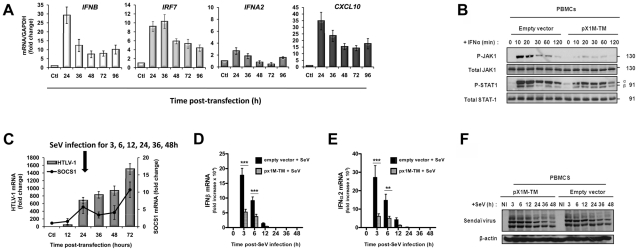
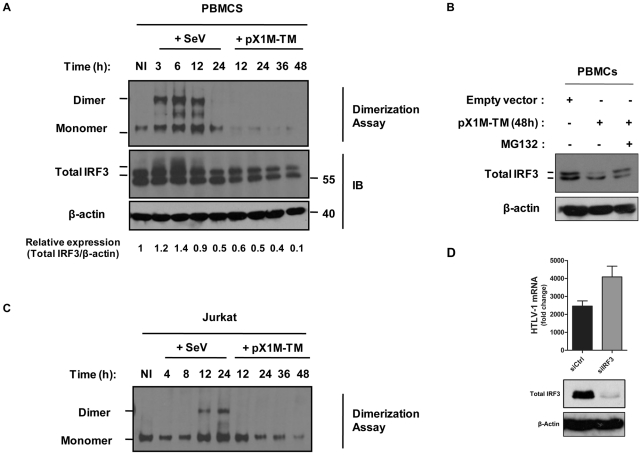
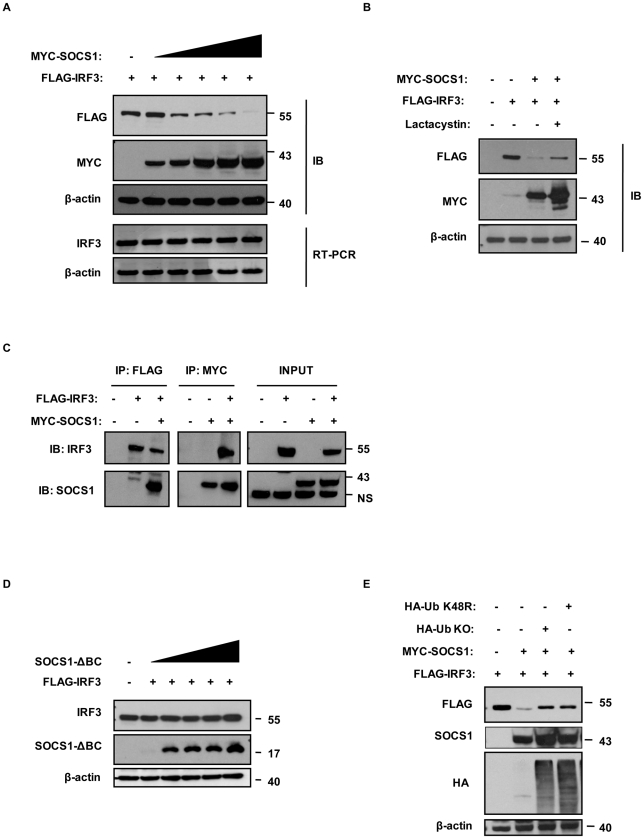
Human T cell leukemia virus type 1 (HTLV-1) is the etiologic agent of Adult T cell Leukemia (ATL) and the neurological disorder HTLV-1-associated myelopathy/tropical spastic paraparesis (HAM/TSP). Although the majority of HTLV-1-infected individuals remain asymptomatic carriers (AC) during their lifetime, 2-5% will develop either ATL or HAM/TSP, but never both. To better understand the gene expression changes in HTLV-1-associated diseases, we examined the mRNA profiles of CD4+ T cells isolated from 7 ATL, 12 HAM/TSP, 11 AC and 8 non-infected controls. Using genomic approaches followed by bioinformatic analysis, we identified gene expression pattern characteristic of HTLV-1 infected individuals and particular disease states. Of particular interest, the suppressor of cytokine signaling 1--SOCS1--was upregulated in HAM/TSP and AC patients but not in ATL. Moreover, SOCS1 was positively correlated with the expression of HTLV-1 mRNA in HAM/TSP patient samples. In primary PBMCs transfected with a HTLV-1 proviral clone and in HTLV-1-transformed MT-2 cells, HTLV-1 replication correlated with induction of SOCS1 and inhibition of IFN-α/β and IFN-stimulated gene expression. Targeting SOCS1 with siRNA restored type I IFN production and reduced HTLV-1 replication in MT-2 cells. Conversely, exogenous expression of SOCS1 resulted in enhanced HTLV-1 mRNA synthesis. In addition to inhibiting signaling downstream of the IFN receptor, SOCS1 inhibited IFN-β production by targeting IRF3 for ubiquitination and proteasomal degradation. These observations identify a novel SOCS1 driven mechanism of evasion of the type I IFN antiviral response against HTLV-1.


Conflict of interest statement

The authors have declared that no competing interests exist.

Figures

Figure 1
Figure 1. Expression profiling of genes differentially expressed in HTLV-1 associated-diseases.
(A) Unsupervised hierarchical clustering of the 1039 genes differentially expressed in CD4+ T lymphocytes from 7 ATL, 12 HAM/TSP, 11 AC and 8 NI donors. Significant variation in the expression pattern of 1039 genes was determined by ANOVA (p<0.01). Each row represents the relative level of expression for a single gene; each column shows the expression level for a single sample. The yellow and blue colors indicate high and low expression, respectively. Genes were clustered into 3 groups using a complete linkage and Pearson correlation as distance metric. (B) Pair-wise contrast by Correspondance Analysis (PCA). PCA analysis was performed on the 1039 genes selected by ANOVA. Correspondence analysis shows genes plotted in discriminate space and separated into 6 groups: genes associated specifically with ATL, HAM/TSP or AC, and genes commonly regulated in the three groups; AC-HAM/TSP, AC-ATL or ATL-HAM/TSP. Colored lines denote the direction of class medians and black dots correspond to the genes. Genes with high differential expression in a group are located far-off the center (gene expression of NI), in the direction determined by the group. The closest to the group line, the more evident is the associations of the genes with that group. Genes that are down-regulated in this group appear on the opposite site of the centroid. A short list of the top genes was created by selecting the genes having ≥2 fold changes relative to NI. The genes lists are ranked by the absolute variation (Max-Min) in fold change expression among the three HTLV-1 infected groups.
Figure 2
Figure 2. HTLV-1 infection results in the induction of SOCS1 mRNA levels in ex vivo CD4+ T cells and correlates with HTLV-1 mRNA expression.
(A, B) Comparison of mRNA expression of SOCS1 and SOCS3 in CD4+ T cells from HTLV-1 infected and NI patients. CD4+ T cells were isolated from PBMCs of HTLV-1 infected and NI patients; SOCS1 (A) and SOCS3 (B) mRNA levels were assessed using a human cDNA array. SOCS1 gene expression was stratified by clinical status forming 4 groups: NI, ATL, AC and HAM/TSP. Each point represents SOCS level from one individual, with black bars showing median value in each group. Mann-Whitney test was used to compare intensity of SOCS expression between groups (*, p<0.05; ***, p<0.001). (C) Expression of SOCS1 mRNA levels correlated with HTLV-1 mRNA load in HAM/TSP patients. CD4+ T cells from HAM/TSP and NI patients were lysed and total RNA was subjected to reverse transcription. cDNA was analyzed by quantitative real time PCR to assess mRNA levels of SOCS1 and HTLV-1 (Pearson's correlation p<0.0001, line represents log-log non-linear fit of the data) (D) Expression of SOCS1 and HTLV-1 mRNAs was measured in HTLV-1-carrying T cell lines (MT-2, MT-4, C8166, RMP) vs. HTLV-1-negative T cell lines (CEM, Jurkat). Cells were treated as previously and cDNA was analyzed by quantitative real time PCR to measured SOCS1 and HTLV-1 gene expression. Equivalent mRNA amounts were normalized to GAPDH gene expression and calculated as fold change with the levels of uninfected CEM cells set arbitrarily as 1. (E) PBMCs from healthy individuals were electroporated with either HTLV-1 provirus (pX1M-TM) or control empty vector (ctl). At the indicated times, total RNA was extracted and analyzed for SOCS1 and HTLV-1 gene expression. Equivalent mRNA amounts were normalized to GAPDH mRNA expression and calculated as fold change from the levels of control cells that were arbitrarily set as 1.
Figure 3
Figure 3. SOCS1 promotes HTLV-1 mRNA synthesis.
(A) CEM cells were transfected with pX1M-TM alone or co-transfected with pX1M-TM and Myc-tagged SOCS1 expression vectors. At 24 h post-transfection, total RNA was extracted and evaluated for HTLV-1 (A) gene expression by real time PCR. Equivalent mRNA amounts were normalized to GAPDH mRNA expression and calculated as fold change of the levels of control cells which were arbitrarily set as 1 (*** p<0.001). (B) Depletion of SOCS1 decreases HTLV-1 mRNA synthesis in MT-2 cells. MT-2 cells were electroporated with control or SOCS1 specific-siRNAs (siSOCS1 (1), siSOCS1 (2), or a pool of both siSOCS1 (1) and siSOCS (2)). At 72 h post-transfection, total RNA was extracted and analyzed for HTLV-1 and SOCS1 mRNA levels. MT2 cells were treated as in B; cells lysates were prepared at 72 h post-electroporation, and equal amounts of protein (20 µg) were resolved by SDS-PAGE followed by immunoblotting against SOCS1, with β-actin shown as a loading control (bottom panel).
Figure 4
Figure 4. HTLV-1 infection results in the inhibition of type I IFN gene expression.
(A) PBMCs from healthy individuals were electroporated with either HTLV-1 provirus (pX1M-TM) or control empty vector (ctl). At the indicated times, total RNA was extracted and analyzed for, IFN-β, IRF7, IFN-α2, CXCL10 (A) gene expression. Equivalent mRNA amounts were normalized to GAPDH mRNA expression and calculated as fold change from the levels of control cells that were arbitrarily set as 1. (B) HTLV-1 inhibits IFN-α-induced tyrosine phosphorylation of JAK1 and STAT1. PBMCs were electroporated as in (A) and 48 h post-transfection cells were left-untreated or treated with 1000U/ml IFN-α. Cells lysates were prepared at indicated times and equal amounts of protein (50 µg) were resolved by SDS-PAGE followed by immunoblotting against Tyr-701-phosphorylated STAT1, total STAT1, Tyr-1022/1023-phosphorylated JAK1, total JAK1, with β-actin shown as a loading control. (C, D, E, F) HTLV-1 inhibits SeV-mediated type I IFN gene expression. PBMCs were electroporated with either HTLV-1 provirus (pX1M-TM) or control empty vector for 24 h prior to SeV infection. Total RNA was extracted at the indicated times and analyzed for HTLV-1 (C), IFN-β (D) and IFNα2 (E) mRNA levels by real time PCR. Equivalent mRNA amounts were normalized to GAPDH mRNA expression and calculated as fold change from the expression levels of control cells that were arbitrarily set as 1 (**, p<0.05; *** p<0.001). (F) PBMCs were treated as in C, D, E; cells lysates were prepared at 3–48 h post-SeV infection, and equal amounts of protein (20 µg) were resolved by SDS-PAGE followed by immunoblotting with anti-SeV antisera. Immunoblotting against β-actin is shown as a loading control.
Figure 5
Figure 5. SOCS1 suppresses the antiviral response.
Depletion of SOCS1 restores the type I and II IFN signaling in MT-2 cells. MT-2 cells were electroporated with control or SOCS1 specific-siRNAs (siSOCS1 (1), siSOCS1 (2), or a pool of siSOCS1 (1) and siSOCS1 (2)). At 72 h post-transfection, total RNA was extracted and analyzed for IFN-β, ISG56, CXCL10 and IFN-γ mRNA levels.
Figure 6
Figure 6. HTLV-1 induces degradation of endogenous IRF3.
(A). PBMCs from healthy individuals were electroporated with either HTLV-1 provirus (pX1M-TM) or empty vector. PBMCs transfected with the control vector were subsequently infected with SeV. At the indicated times, lysates from transfected or infected PBMCs were electrophoretically resolved under non-denaturing or denaturing conditions. Western blot analysis was used to locate monomer and dimer forms of IRF3 in the non-denaturing gel (upper panel), and global IRF3 protein in the denaturing gel (lower panel). Immunoblotting against β-actin was used as a loading control. Total IRF3 protein expression levels (upper band) were quantified and normalized to β-actin levels using the Scion Image 4.0 software program. (B) Degradation of IRF3 is inhibited by the proteasome inhibitor (MG132). PBMCs were treated as indicated in (A). At 48 h post-HTLV-1 provirus, cells were incubated with 5 µM of MG132 for 6 h. Cells lysates were prepared and equal amounts of protein (20 µg) were resolved by SDS-PAGE followed by immunoblotting against IRF3, with β-actin shown as a loading control. (C) Same experiments and analysis for IRF3 dimerization were performed in the Jurkat leukemic T cell line. (D) Loss of IRF3 enhances HTLV-1 mRNA load in infected T cells. Jurkat cells were electroporated with control or a pool of IRF3 specific-siRNAs, and re-transfected at 24 h with HTLV-1 provirus (pX1M-TM) vector. At 72 h post-transfection, total RNA was extracted and analyzed for HTLV-1 mRNA levels. Cells lysates were prepared at 72 h post-electroporation, and equal amounts of protein (20 µg) were resolved by SDS-PAGE followed by immunoblotting against IRF3, with β-actin shown as a loading control.
Figure 7
Figure 7. IRF3 interacts with SOCS1 and undergoes SOCS1-mediated degradation and ubiquitination.
(A) HEK293 T cells co-transfected with increasing amounts of SOCS1 promotes degradation of IRF3 in a concentration-dependent manner. HEK293 T cells were co-transfected with Flag-tagged IRF3 and increasing amount of Myc-tagged SOCS1 expression vectors. Cells were collected 24 h post-transfection for either RNA extraction or whole cell extract (WCE) preparation. Immunoblot analysis for SOCS1 and IRF3 protein expression was performed by incubating with antibodies against Myc, Flag, or β-actin, respectively (upper panel). RNA (1 µg) from each sample was subjected to RT-PCR for selective amplification of specific IRF3 mRNA and the constitutively expressed β-actin, as a control. PCR products were separated on a 2% agarose gel and visualized with ethidium bromide staining (lower panel). (B) Degradation of IRF3 is inhibited by the proteasome inhibitor (lactacytin). HEK293 T cells were co-transfected with expression vectors as indicated in (A) and incubated with 10 µM of lactacystin. Twenty four hours post-transfection equal amounts of proteins (30 µg) were resolved by SDS-PAGE followed by immunoblotting with antiserum specific for Flag and Myc. Immunoblotting against β-actin was performed as loading control. (C) Interaction between IRF3 and SOCS1. HEK293 T cells were co-transfected with expresssion vectors for Myc-tagged SOCS1 and Flag-tagged IRF3; at 24 h post-transfection, cells lysates were immunoprecipitated with Flag or Myc antibodies, and the precipitates were immunoblotted to assess Flag and Myc proteins expression. (D) IRF3 is degraded in a SOCS-Box-dependent manner. HEK293 T cells were co-transfected with Flag-tagged IRF3 and increasing amount of a deletion mutant of SOCS1 (SOCS1-ΔBC-Box) expression vectors. Cells were collected 24 h post-transfection for WCE preparation. Immunoblot analysis for SOCS1 and IRF3 protein expression were performed and incubated with antibodies against SOCS1, Flag, or β-actin, respectively. (E) SOCS1 mediated IRF3 ubiquitination. HEK293 T cells were co-transfected with Flag-tagged IRF3, Myc-tagged SOCS1 and either KO or K48R ubiquitin mutant expression vectors. Cells were collected 24 h post-transfection for WCE preparation. Immunoblot analysis for IRF3, SOCS1, Ub protein expression were performed and incubated with antibodies against Myc, Flag, Ha or β-actin, respectively.

Similar articles

Cited by

References

    1. Grant C, Barmak K, Alefantis T, Yao J, Jacobson S, et al. Human T cell leukemia virus type I and neurologic disease: events in bone marrow, peripheral blood, and central nervous system during normal immune surveillance and neuroinflammation. J Cell Physiol. 2002;190:133–159. - PubMed
    1. Bangham CR, Meekings K, Toulza F, Nejmeddine M, Majorovits E, et al. The immune control of HTLV-1 infection: selection forces and dynamics. Front Biosci. 2009;14:2889–2903. - PubMed
    1. Ohshima K. Pathological features of diseases associated with human T-cell leukemia virus type I. Cancer Sci. 2007;98:772–778. - PMC - PubMed
    1. Proietti FA, Carneiro-Proietti AB, Catalan-Soares BC, Murphy EL. Global epidemiology of HTLV-I infection and associated diseases. Oncogene. 2005;24:6058–6068. - PubMed
    1. Sabouri AH, Usuku K, Hayashi D, Izumo S, Ohara Y, et al. Impaired function of human T-lymphotropic virus type 1 (HTLV-1)-specific CD8+ T cells in HTLV-1-associated neurologic disease. Blood. 2008;112:2411–2420. - PubMed

Publication types

MeSH terms