. 2010 Nov 8;5(11):e13879.
doi: 10.1371/journal.pone.0013879.

Inhibition of glioblastoma growth by the thiadiazolidinone compound TDZD-8

Affiliations

Inhibition of glioblastoma growth by the thiadiazolidinone compound TDZD-8

Diana Aguilar-Morante et al. PLoS One. .

Abstract

Background: Thiadiazolidinones (TDZD) are small heterocyclic compounds first described as non-ATP competitive inhibitors of glycogen synthase kinase 3β (GSK-3β). In this study, we analyzed the effects of 4-benzyl-2-methyl-1,2,4-thiadiazolidine-3,5-dione (TDZD-8), on murine GL261 cells growth in vitro and on the growth of established intracerebral murine gliomas in vivo.

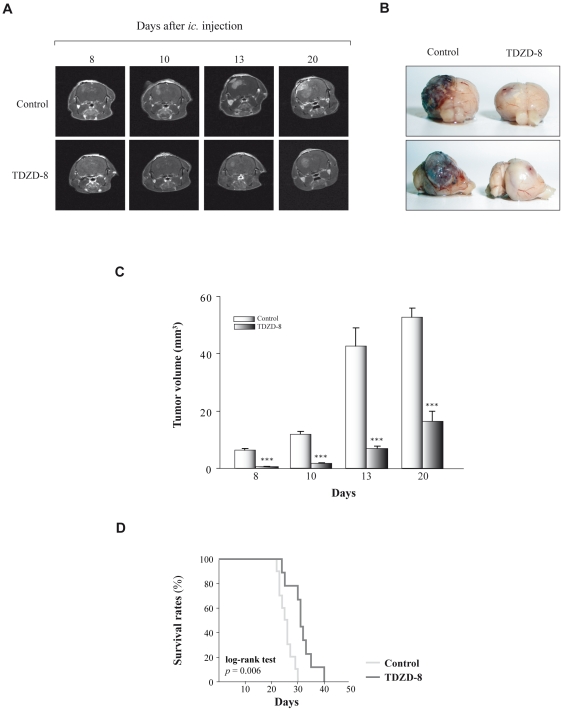
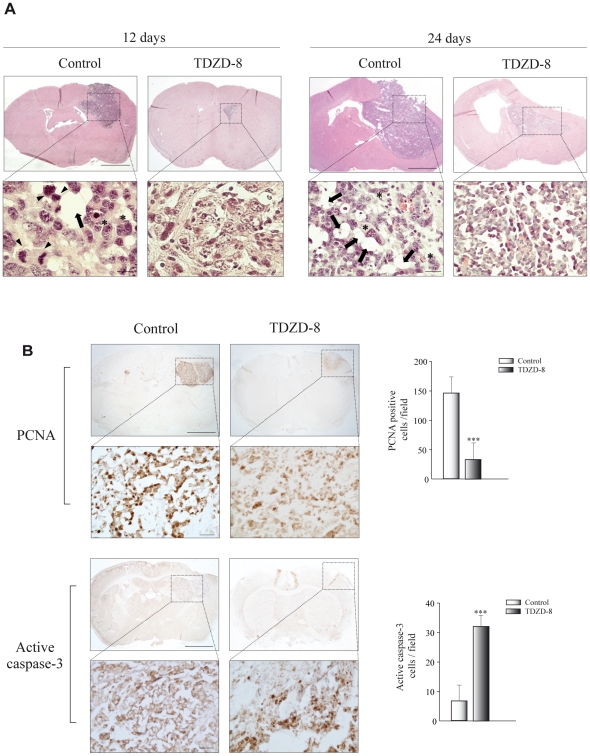
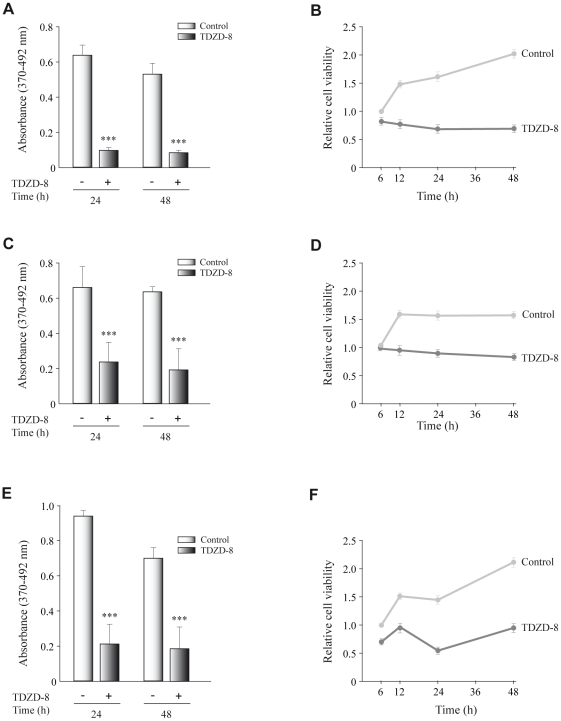
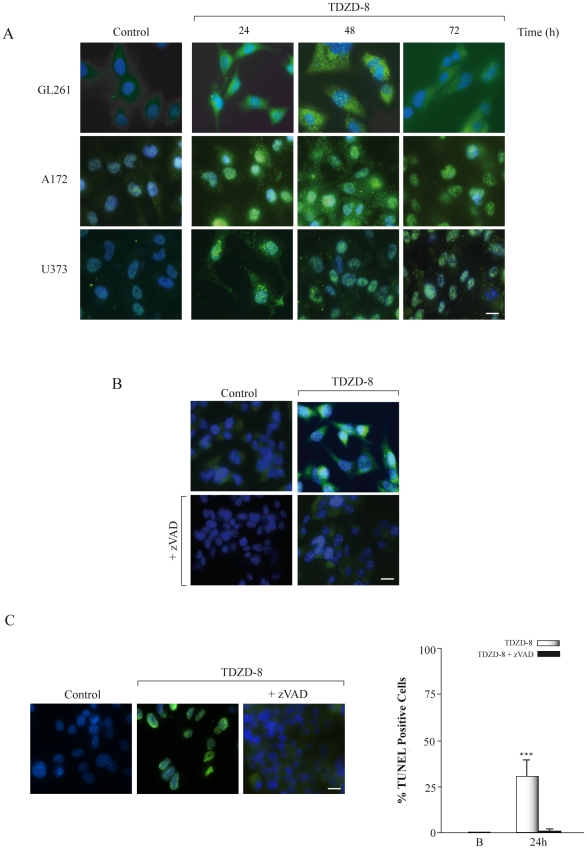
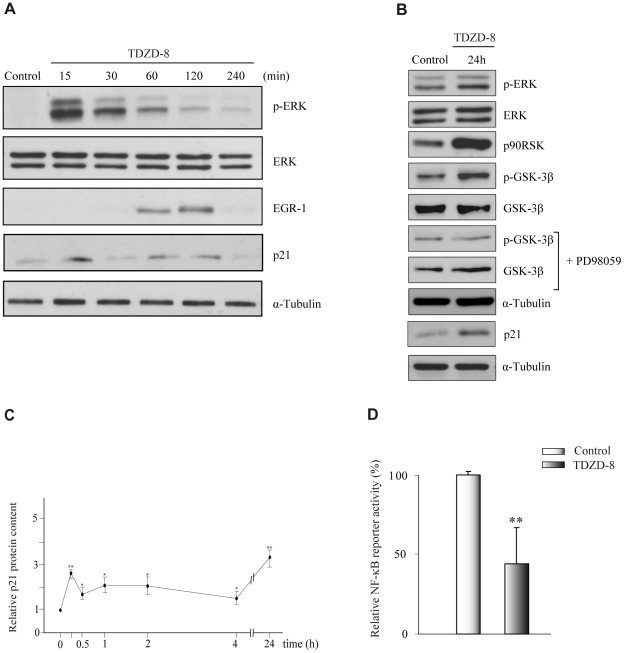
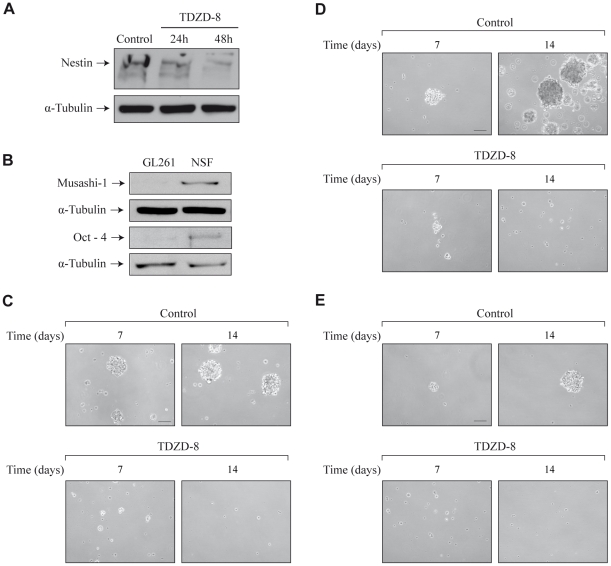
Methodology/principal findings: Our data show that TDZD-8 decreased proliferation and induced apoptosis of GL261 glioblastoma cells in vitro, delayed tumor growth in vivo, and augmented animal survival. These effects were associated with an early activation of extracellular signal-regulated kinase (ERK) pathway and increased expression of EGR-1 and p21 genes. Also, we observed a sustained activation of the ERK pathway, a concomitant phosphorylation and activation of ribosomal S6 kinase (p90RSK) and an inactivation of GSK-3β by phosphorylation at Ser 9. Finally, treatment of glioblastoma stem cells with TDZD-8 resulted in an inhibition of proliferation and self-renewal of these cells.

Conclusions/significance: Our results suggest that TDZD-8 uses a novel mechanism to target glioblastoma cells, and that malignant progenitor population could be a target of this compound.


Conflict of interest statement

Competing Interests: The authors have declared that no competing interests exist.

Figures

Figure 1
Figure 1. Effects of TDZD-8 treatment on tumor growth in vivo.
(A) Representative T1 magnetic resonance imaging (MRI) pictures obtained form mice injected with GL261 and treated with TDZD-8 (5 mg/Kg). T1-weighted imaging was performed at 7 Tesla as described in Materials and Methods at different times after injection. (B) Representative photographs of GL261 tumors 24 days after implantation are shown. (C) Quantitative analysis of total tumor volumes. Values represent the mean ± SD from five different animals. (D) Kaplan-Meier plots and log-rank statistics analysis of overall survival reveal that TDZD-8 treatment significantly improves survival of tumor-bearing mice compared with their non-treated controls (log-rank test p = 0.006).
Figure 2
Figure 2. Histological and immunohistochemical analysis of tumors induced by GL261 glioblastoma cells.
(A) Representative hematoxylin-eosin stained sections of tumors at 12 and 24 days after injection. Insets show higher magnifications of images shown in the upper panels. Tumors derived from control animals showed clear mixoid matrices (arrows), multinucleated malignant and pleomorphic cells (asterisks), and numerous mitotic figures (arrowheads). (B) Immunohistochemical study of tumor sections for PCNA and active caspase-3 detection 12 days after injection of GL261 cells. Insets show a higher magnification of the images shown in the upper panels. Scale bars, 300 µm. Insets scale bars, 25 µm. Quantification of the number of active caspase-3 and PCNA positive cells was evaluated in tumor sections and values expressed as mean ± SD. positive cells/field. ***p≤0.001.
Figure 3
Figure 3. Effect of TDZD-8 treatment on cell proliferation and survival in different glioblastoma cell lines.
GL261 (A, B), A172 (C, D) and U373 (E, F). (A, C, E) Proliferation rates determined by a BrdU incorporation assay. Tumoral cells were seeded into individual wells of a 96-well plate and cultivated for 24 and 48 h in the presence or absence of TDZD-8 after which BrdU was added to the culture medium. Cells were harvested 16 h after BrdU addition. Indicated are the means ± SD measured. (B, D, F) Cells were seeded in a 96-well plate and at different times after plating cell viability was determined by the MTT assay, as indicated in Materials and Methods. Values are the means ± SD of at least three different experiments.
Figure 4
Figure 4. Effect of TDZD-8 treatment on apoptosis.
(A) Different glioblastoma cell lines were grown on glass coverslips, treated with TDZD-8 for different times and active caspase-3 was analyzed by immunofluorescence using a specific anti-active caspase-3 antibody. (B) GL261 glioblastoma cells were grown for 24 h on glass coverslips, treated with TDZD-8 or TDZD-8 plus zVAD-fmk and active caspase-3 was analyzed by immunofluorescence using a specific anti-active caspase-3 antibody. Scale bar, 25 µm. (C) GL261 glioblastoma cells were grown for 24 h on glass coverslips, treated with TDZD-8 or TDZD-8 plus zVAD-fmk and TUNEL analysis was performed. Representative immunofluorescence images are shown. Scale bar, 25 µm. Quantification of TUNEL-positive cells 24 h after TDZD-8 treatment is shown in the right panel. B, basal non-treated cells. Values are the means ± SD of at least three different experiments.
Figure 5
Figure 5. TDZD-8 activates the ERK signaling pathway.
(A, B) GL261 cells were treated or not with TDZD-8 for different times and then stained with the corresponding primary antibodies. Some cultures were pretreated for 1 h with the ERK inhibitor PD98059. (C) Quantification of the kinetic induction of p21 by TDZD8. (D) A reporter assay was performed to measure the transcriptional activity of NF-κB. GL261 cells were transfected with 3xNF-tk-luc reporter construct for 48 h in the presence or absence of TDZD-8 and luciferase activity was measured.
Figure 6
Figure 6. Effect of TDZD-8 on neurosphere formation.
(A) Representative Western blot showing Nestin expression in adherent GL261 cells treated with TDZD-8. (B) Representative Western blot of stem cells markers musashi-1 and oct-4 in adherent GL261 and neurospheres cultures 7 days after plating. (C) Representative microphotographs of primary neurosphere cultures 7 and 14 days after plating in neurosphere medium. D) Primary neurospheres were dissociated and plated to analyze secondary neurosphere formation. Representative microphotographs are shown. (E) Representative microphotographs showing self-renewal capacity of neurosphere cultures growing in the presence or absence of TDZD-8. Scale bar, 100 µm.

References

    1. DeAngelis LM. Brain tumors. N Engl J Med. 2001;344:114–123. - PubMed
    1. Benedetti S, Pirola B, Pollo B, Magrassi L, Bruzzone MG, et al. Gene therapy of experimental brain tumors using neural progenitor cells. Nat Med. 2000;6:447–450. - PubMed
    1. Fomchenko EI, Holland EC. Mouse models of brain tumors and their applications in preclinical trials. Clin Cancer Res. 2006;12:5288–5297. - PubMed
    1. Jope RS, Johnson GV. The glamour and gloom of glycogen synthase kinase-3. Trends Biochem Sci. 2004;29:95–102. - PubMed
    1. Kim L, Kimmel AR. GSK3, a master switch regulating cell-fate specification and tumorigenesis. Curr Opin Genet Dev. 2000;10:508–514. - PubMed

Publication types

MeSH terms