Randomized Controlled Trial
. 2010 Nov 5;5(11):e13865.
doi: 10.1371/journal.pone.0013865.

MEG responses to the perception of global structure within glass patterns

Affiliations
Randomized Controlled Trial

MEG responses to the perception of global structure within glass patterns

Jennifer B Swettenham et al. PLoS One. .

Abstract

Background: The perception of global form requires integration of local visual cues across space and is the foundation for object recognition. Here we used magnetoencephalography (MEG) to study the location and time course of neuronal activity associated with the perception of global structure from local image features. To minimize neuronal activity to low-level stimulus properties, such as luminance and contrast, the local image features were held constant during all phases of the MEG recording. This allowed us to assess the relative importance of striate (V1) versus extrastriate cortex in global form perception.

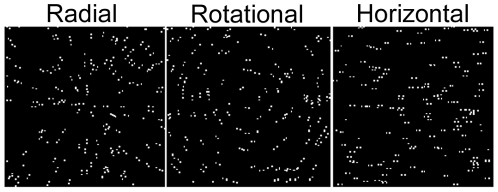
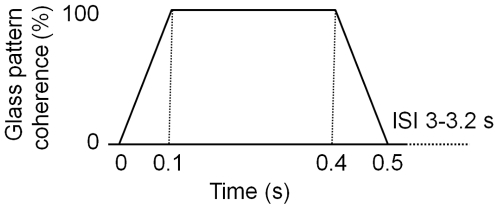
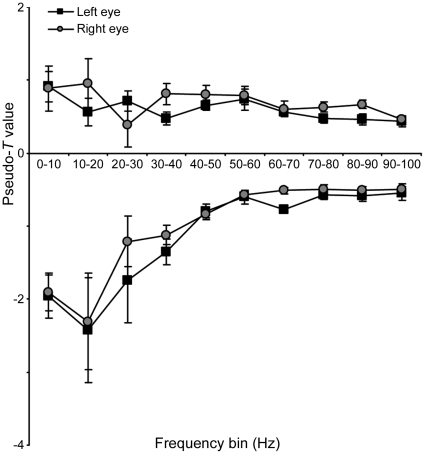
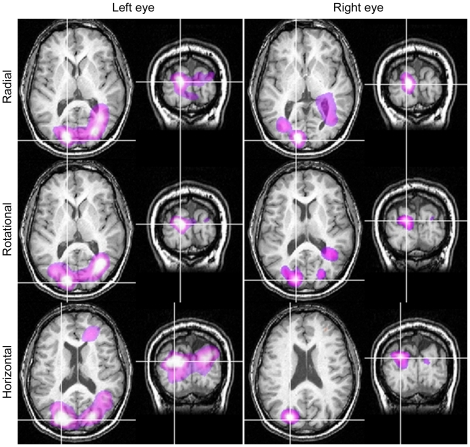
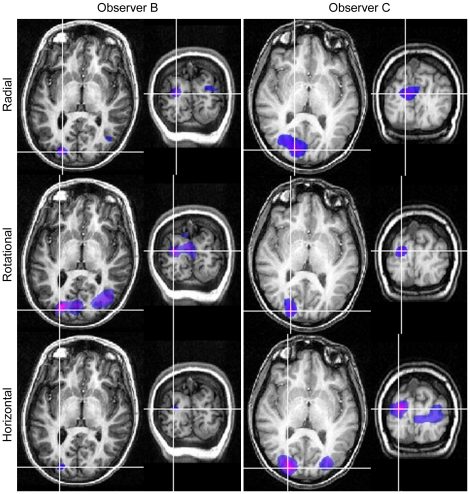
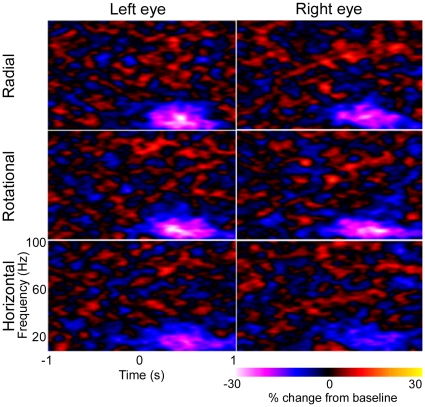
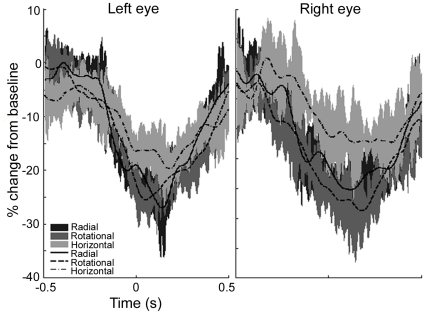
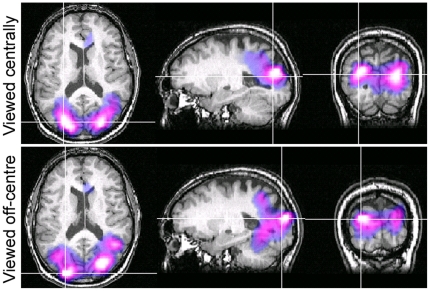
Methodology/principal findings: Stimuli were horizontal, rotational and radial Glass patterns. Glass patterns without coherent structure were viewed during the baseline period to ensure neuronal responses reflected perception of structure and not changes in local image features. The spatial distribution of task-related changes in source power was mapped using Synthetic Aperture Magnetometry (SAM), and the time course of activity within areas of maximal power change was determined by calculating time-frequency plots using a Hilbert transform. For six out of eight observers, passive viewing of global structure was associated with a reduction in 10-20 Hz cortical oscillatory power within extrastriate occipital cortex. The location of greatest power change was the same for each pattern type, being close to or within visual area V3a. No peaks of activity were observed in area V1. Time-frequency analyses indicated that neural activity was least for horizontal patterns.

Conclusions: We conclude: (i) visual area V3a is involved in the analysis of global form; (ii) the neural signature for perception of structure, as assessed using MEG, is a reduction in 10-20 Hz oscillatory power; (iii) different neural processes may underlie the perception of horizontal as opposed to radial or rotational structure; and (iv) area V1 is not strongly activated by global form in Glass patterns.


Conflict of interest statement

Competing Interests: The authors have declared that no competing interests exist.

Figures

Figure 1
Figure 1. Schematic illustration of Glass patterns.
Figure 2
Figure 2. Schematic illustration of coherence changes within the Glass pattern during a trial.
Figure 3
Figure 3. Largest energy changes in each 10 Hz frequency bin of SAM analysis.
For each of the SAM analyses, performed in 10 Hz frequency bins for 1 s pre- vs. 1 s post-onset of coherent structure in the Glass pattern, the mean (n = 8) of the largest negative and positive pseudo-T value observed in occipital cortex is plotted. Negative and positive pseudo-T values represent decreases and increases respectively in energy compared with baseline (viewing Glass pattern with random structure). Error bars represent one standard error of the mean.
Figure 4
Figure 4. SAM images (n = 1) showing similar regions of activity irrespective of viewing eye or pattern type.
SAM images for Observer A showing statistical estimates of power changes within the 10–20 Hz frequency band with 1 s time windows. The colour indicates the amplitude of the pseudo-T statistic (2<T<6) with blue/purple colours representing power decreases. SAM images are overlaid on the individual's structural MR, with axial and coronal slices through the voxel with the largest power change.
Figure 5
Figure 5. SAM images for two observers showing similar regions of activity irrespective of pattern type.
SAM images for Observers B (left column) and C (right column), left eye viewing, showing statistical estimates of power changes within the 10–20 Hz frequency band with 1 s time windows. The colour indicates the amplitude of the pseudo-T statistic (2<T<6) with blue/purple colours representing power decreases. SAM images are overlaid on each individual's structural MR, with axial and coronal slices through the voxel with the largest power change.
Figure 6
Figure 6. Mean (n = 5) time-frequency plots.
Mean (n = 5) time-frequency plots are shown for virtual electrodes placed at the location of maximal power change as determined using SAM (10–20 Hz, 1 s time windows). All virtual electrodes were in visual cortex.
Figure 7
Figure 7. Temporal evolution of the 10–20 Hz group average (n = 5) response.
Group average (n = 5) responses showing the temporal evolution of the 10–20 Hz cortical response in visual cortex to viewing coherent structure. The shaded regions indicate the standard error of the mean across participants.
Figure 8
Figure 8. SAM images showing similar regions of activation for central and off-centre viewing.
SAM images for Observer A showing statistical estimates of power changes, from the summed responses to rotational, radial and horizontal Glass patterns, within the 10–20 Hz frequency band with 1 s time windows. The top panels show responses when Glass patterns were centrally viewed and the lower panels show responses when Glass patterns were viewed in the lower-left visual field. The colour indicates the amplitude of the pseudo-T statistic (2<T<6) with blue/purple colours representing power decreases. SAM images are overlaid on the individual's structural MR, with slices through the voxel with the largest power change.

References

    1. Ostwald D, Lam J, Li S, Kourtzi Z. Neural coding of global form in the human visual cortex. J Neurophys. 2008;99:2456–2469. - PubMed
    1. Braddick O, O'Brien J, Wattam-Bell J, Atkinson J, Turner R. Form and motion coherence activate independent, but not dorsal/ventral segregated, networks in the human brain. Curr Biol. 2000;10:731–734. - PubMed
    1. Dumoulin S, Hess R. Cortical specialization for concentric shape processing. Vision Res. 2007;47:1608–1613. - PubMed
    1. Gallant J, Shoup R, Mazer J. A human extrastriate area functionally homologous to macaque V4. Neuron. 2000;27:227–235. - PubMed
    1. van Essen D, Zeki S. The topographic organization of rhesus monkey prestriate cortex. J Physiol. 1978;277:193–226. - PMC - PubMed

Publication types