. 2010 Nov 4;5(11):e13813.
doi: 10.1371/journal.pone.0013813.

Differential volatile signatures from skin, naevi and melanoma: a novel approach to detect a pathological process

Affiliations

Differential volatile signatures from skin, naevi and melanoma: a novel approach to detect a pathological process

Tatjana Abaffy et al. PLoS One. .

Abstract

Background: Early detection of melanoma is of great importance to reduce mortality. Discovering new melanoma biomarkers would improve early detection and diagnosis. Here, we present a novel approach to detect volatile compounds from skin.

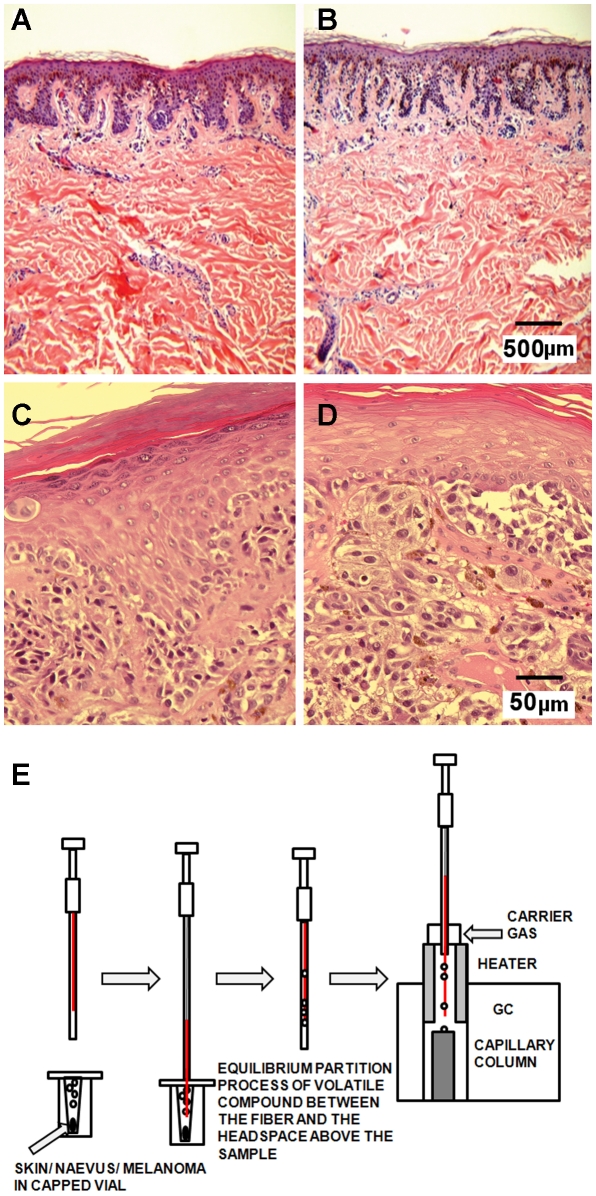
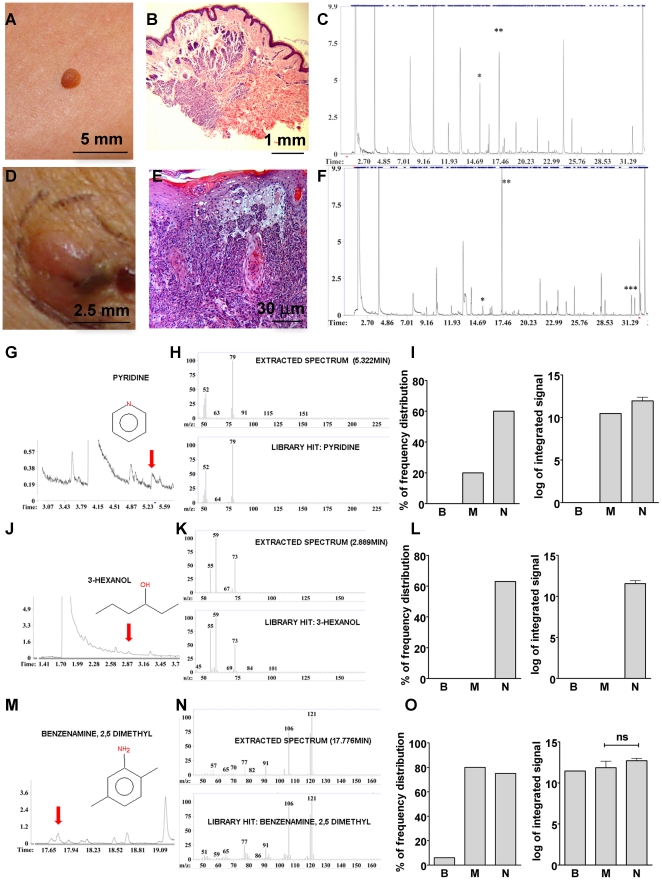
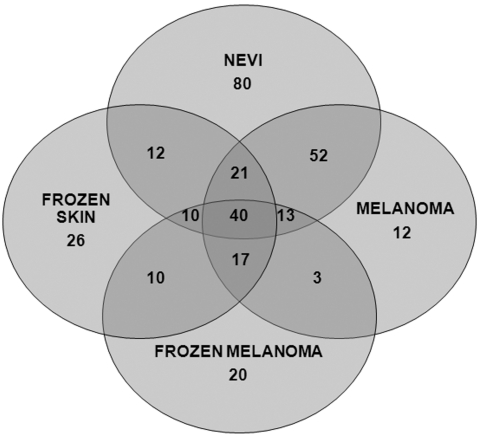
Methods and findings: We used Head Space Solid Phase Micro-Extraction (HS-SPME) and gas chromatography/mass spectrometry (GC/MS) to identify volatile signatures from melanoma, naevi and skin samples. We hypothesized that the metabolic state of tissue alters the profile of volatile compounds. Volatiles released from fresh biopsy tissue of melanoma and benign naevus were compared based on their difference in frequency distribution and their expression level. We also analyzed volatile profiles from frozen tissue, including skin and melanoma.

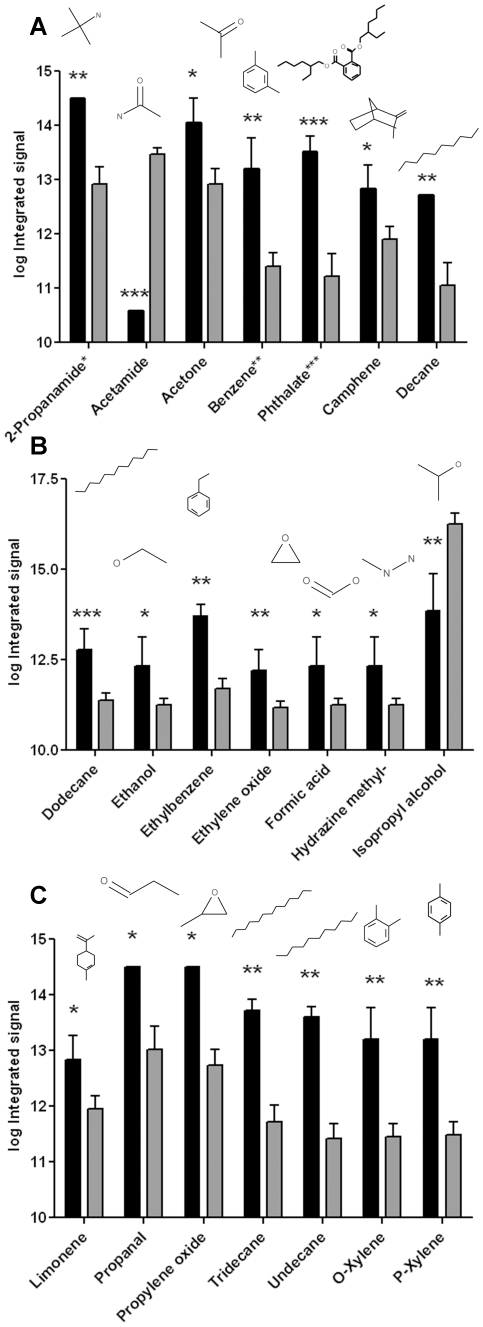
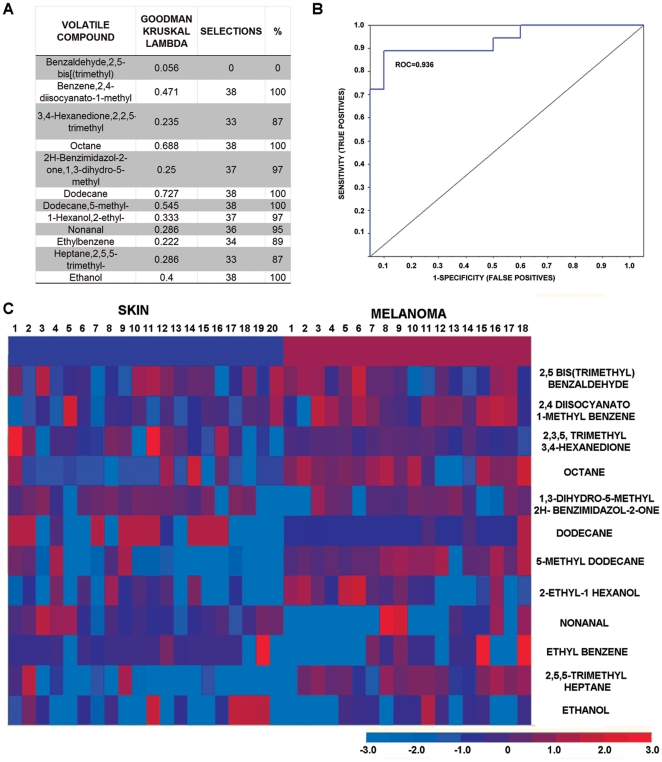
Conclusions: Three volatiles, 4-methyl decane, dodecane and undecane were preferentially expressed in both fresh and frozen melanoma, indicating that they are candidate biomarkers. Twelve candidate biomarkers evaluated by fuzzy logic analysis of frozen samples distinguished melanoma from skin with 89% sensitivity and 90% specificity. Our results demonstrate proof-of-principle that there is differential expression of volatiles in melanoma. Our volatile metabolomic approach will lead to a better understanding of melanoma and can enable development of new diagnostic and treatment strategies based on altered metabolism.


Conflict of interest statement

Competing Interests: The authors have declared that no competing interests exist.

Figures

Figure 1
Figure 1. Volatile collection preserves the tissue morphology.
H&E staining of naevus (A and B) and melanoma (C and D). Histological analysis of the first punch biopsy sample placed immediately in formalin (A and C). Histological analysis of the second punch biopsy, after collection of volatiles (B and D). No obvious deterioration of the tissue samples was detected by the histopathologist. E. Volatile collection by HS-SPME method. Skin, naevi or melanoma 3-mm punch biopsy sample was placed in a small capped vial. PDMS-DVB fiber (red) was exposed to the head-space above the biopsy sample for 1 hour. After volatile collection, the fiber is retracted, and injected into GC/MS.
Figure 2
Figure 2. From melanoma and nevus to volatile signatures.
Pictures from naevus (A) and melanoma skin lesion (D), H&E staining of biopsy from naevus (B) and melanoma lesion (E), chromatograms from naevus (C) and melanoma (F). Some peaks are unique in melanoma (***), some are increased (**) and some are decreased (*) in melanoma vs. naevi. (G, J and M) Chemical structure of pyridine, 3-hexanol and 2,5 dimethyl benzenamine, and their retention time in the chromatograms (indicated by the arrow). (H, K and N) Mass spectra of the indicated peaks (extracted spectrum, above) and mass spectra from the library (library hit and identification of the compound, bellow). (I, L and O) Frequency distribution of these three compounds in blank (B), melanoma (M) and naevi (N) group, as well as their expression analysis (log of integrated signal) are presented (t-test, mean±SEM). In (O) right panel n = 16 for N and n = 3 for M. Dimethyl benzenamine (2,5; 2,3; 2,4 or 2,6) is a volatile compound present in 19 out of 25 naevi samples, in 4 out of 5 melanoma samples and detected in only one air sample. A peak of 2,5 dimethyl benzenamine is shown eluting at 17.8 min. This compound is common in both melanoma and naevi group.
Figure 3
Figure 3. Differentially expressed volatile compounds in melanoma vs naevi.
The expression level of compounds as indicated by log of integrated signal, in melanoma group (black bars, n = 5) and naevi group (grey bars, n = 25) are shown in panels A, B and C. Data are expressed as mean ± STDEV, *p = 0.05–0.09, **p = 0.005–0.05, ***p = 0.0001–0.005. In A: 2-propanamide* is 2-propanamide, 2-methyl; benzene** is benzene, 1,3 dimethyl and phthalate*** is bis(2-ethylhexyl) phthalate.
Figure 4
Figure 4. Fuzzy logic analysis of frozen skin and melanoma samples.
A. list of the volatile compounds, their Goodman Kruskal Lambda values, the number of selections in all (38) leave-one-out runs, and the percentage of how often they were selected. B. Receiver operating characteristic curve (ROC). C. Heat map for the frozen data. Each column represents one sample. Each row represents one compound. Red colors represent retention time (RT) values that are high above the average; blue colors represent RT-values that are low and much below average. The first row represents the category; whether the sample belongs to the skin samples (left 20 columns with blue color in the first row) or to the melanoma samples (rights 18 columns with red color in the first row). The light blue color represents a missing value. Misclassified in the leave one out method are samples 4 and 12 from skin group, and samples 14 and 18 from the melanoma group.
Figure 5
Figure 5. A Venn diagram showing the number of volatile compounds specific for each tested group as well as the numbers of overlapping volatiles between the groups (e.g., naevi has 80 volatiles not expressed in any other group).

Similar articles

Cited by

References

    1. Nicholson JK, Lindon JC. Systems biology: Metabonomics. Nature. 2008;455:1054–1056. - PubMed
    1. Oliver SG. Functional genomics: lessons from yeast. Philos Trans R Soc Lond B Biol Sci. 2002;357:17–23. - PMC - PubMed
    1. Dettmer K, Aronov PA, Hammock BD. Mass spectrometry-based metabolomics. Mass Spectrom Rev. 2007;26:51–78. - PMC - PubMed
    1. Griffin JL, Shockcor JP. Metabolic profiles of cancer cells. Nat Rev Cancer. 2004;4:551–561. - PubMed
    1. Dettmer K, Hammock BD. Metabolomics–a new exciting field within the “omics” sciences. Environ Health Perspect. 2004;112:A396–397. - PMC - PubMed

Publication types

MeSH terms

Substances