. 2010 Nov 4;5(11):e15408.
doi: 10.1371/journal.pone.0015408.

ER-α36, a novel variant of ER-α, mediates estrogen-stimulated proliferation of endometrial carcinoma cells via the PKCδ/ERK pathway

Affiliations

ER-α36, a novel variant of ER-α, mediates estrogen-stimulated proliferation of endometrial carcinoma cells via the PKCδ/ERK pathway

Jing-Shan Tong et al. PLoS One. .

Abstract

Background: Recently, a variant of ER-α, ER-α36 was identified and cloned. ER-α36 lacks intrinsic transcription activity and mainly mediates non-genomic estrogen signaling. The purpose of this study was to investigate the function and the underlying mechanisms of ER-α36 in growth regulation of endometrial Ishikawa cancer cells.

Methods: The cellular localization of ER-α36 and ER-α66 were determined by immunofluorescence in the Ishikawa cells. Ishikawa endometrial cancer control cells transfected with an empty expression vector, Ishikawa cells with shRNA knockdown of ER-α36 (Ishikawa/RNAiER36) and Ishikawa cells with shRNA knockdown of ER-α66 (Ishikawa/RNAiER66) were treated with E2 and E2-conjugated to bovine serum albumin (E2-BSA, membrane impermeable) in the absence and presence of different kinase inhibitors HBDDE, bisindolylmaleimide, rottlerin, H89 and U0126. The phosphorylation levels of signaling molecules and cyclin D1/cdk4 expression were examined with Western blot analysis and cell growth was monitored with the MTT assay.

Results: Immunofluorescence staining of Ishikawa cells demonstrated that ER-α36 was expressed mainly on the plasma membrane and in the cytoplasm, while ER-α66 was predominantly localized in the cell nucleus. Both E2 and E2-BSA rapidly activated PKCδ not PKCα in Ishikawa cells, which could be abrogated by ER-α36 shRNA expression. E2-and E2-BSA-induced ERK phosphorylation required ER-α36 and PKCδ. However, only E2 was able to induce Camp-dependent protein kinase A (PKA) phosphorylation. Furthermore, E2 enhances cyclin D1/cdk4 expression via ER-α36.

Conclusion: E2 activates the PKCδ/ERK pathway and enhances cyclin D1/cdk4 expression via the membrane-initiated signaling pathways mediated by ER-α36, suggesting a possible involvement of ER-α36 in E2-dependent growth-promoting effects in endometrial cancer cells.


Conflict of interest statement

Competing Interests: The authors have declared that no competing interests exist.

Figures

Figure 1
Figure 1. Subcellular localization of ER-α36 and ER-α66 in Ishikawa cells.
A. Ishikawa cells cultured on coverslips were fixed and immunofluorescently stained with the anti-ER-α36 specific antibody (green). The cells were also stained with Hoechst 33258 (blue) to show the cell nuclei. B. ER-α66 expression detected by immunofluorescence in Ishikawa cells. The nucleus was stained by Hoechst 33258. Bar, 10 micrometers.
Figure 2
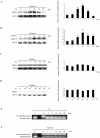
Figure 2. Effects of E2 and E2-BSA on the activation of PKCδ, PKCα and PKA in Ishikawa cells.
A and B. Serum starved Ishikawa cell was treated with 10 nM E2 or 10 nM E2-BSA for the indicated time points. Protein extracts were prepared and used for Western blot analysis to measure levels of PKCδ phosphorylation. Protein levels of total PKCδ were also examined as controls. Each bar represents mean value ± SEM (n = 3). *, P<0.05 compared to untreated cells. C. Serum starved Ishikawa cell was treated with 10 nm E2 for the indicated time points and cells were lysed for western blot analysis to measure levels of PKCα phosphorylation. Protein levels of total PKCα were measured as controls. D, Serum starved Ishikawa cell was treated with 0, 0.1,1, 10, 100 and 1,000 nM E2 for 20 min. Protein extract was prepared for Western blot analysis to measure levels of PKCα phosphorylation and total PKCα. E and F, Serum starved Ishikawa cells were treated with 10 nM E2 or 10 nM E2-BSA for indicated time points, 20 µM Forskolin (F) was added for 15 min as a positive control, after which the cells were lysed and tested in the PepTag PKA assay. Samples were separated on an agarose gel. The lower band represents phosphorylated peptide, and the upper band represents the remaining unphosphorylated peptide.
Figure 3
Figure 3. ER-α36 mediates E2-stimulated PKCδ activation.
A and B. ER-α36 expression in Ishikawa/V and Ishikawa/RNAiER36 cells. Each bar represents mean value ± SEM (n = 3). *, P<0.05 compared to Ishikawa/V cells. C. Ishikawa/V and Ishikawa/RNAiER36 cells were treated with 10 nm E2 or 10 nm E2-BSA for 10 min, and PKCδ phosphorylation was analyzed by Western blot. Total levels of PKCδ were measured as controls, and each bar repents mean value ± SEM (n = 3). *, P<0.05 compared to untreated cells. #, P<0.05 compared to E2- or E2-BSA- treated Ishikawa/V cells. D and E. ER-α66 expression in Ishikawa/V and Ishikawa/RNAiER66 cells. Each bar represents mean value ± SEM (n = 3). *, P<0.05 compared to Ishikawa/V cells. F. Ishikawa/V and Ishikawa/RNAiER66 cells were treated with 10 nM E2 or 10 nM E2-BSA for 10 min, and then PKCδ phosphorylation was assessed with Western blot. Total PKCδ was measured as controls. Each bar represents mean value ± SEM (n = 3). *, P<0.05 compared to untreated cells. G, Hec1A/V and Hec1A/RNAiER36 cells were treated with 10 nM E2 or 10 nM E2-BSA for 10 min, and PKCδ phosphorylation was analyzed by Western blot. Total PKCδ was measured as controls. Each bar represents mean value ± SEM (n = 3).*, P<0.05 compared to untreated cells. #, P<0.05 compared to E2- or E2-BSA-treated Hec-1A/V cells.
Figure 4
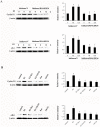
Figure 4. E2 activates the ERK1/2 through the PKCδ signaling pathway.
A. Serum starved Ishikawa cells were treated with E2-BSA for indicated time points and cell lysates were immunoblotted with antibody against phosphorylated ERK1/2. Levels of phosphorylation were normalized with the total ERK1/2 protein, and each bar represents means value ± SEM (n = 3). *, P<0.05 compared to untreated cells. B. Ishikawa/V and Ishikawa/RNAiER36 cells were treated with 10 nM E2 or 10 nM E2-BSA for 10 min, and ERK1/2 phosphorylation was analyzed with Western blot. Expression was normalized to total ERK1/2, and each bar represents mean value ± SEM (n = 3).*, P<0.05 compared to untreated cells. #, P<0.05 compared to E2- or E2-BSA-treated Ishikawa/V cells. C. Serum starved Ishikawa cells were treated with 10 nM E2 or together with 5 µM of PKCδ specific inhibitor rottlerin, 5 µM of pan-PKC inhibitor bisindolylmaleimide or 40 µM of PKCα specific inhibitor HBDDE. ERK1/2 phosphorylation was analyzed with Western blot. Expression was normalized to total ERK1/2, and each bar represents mean value ± SEM (n = 3). *, P<0.05 compared to untreated cells. #, P<0.05 compared to E2-treated Ishikawa cells. D. Serum starved Ishikawa cells were treated with 10 nM E2 or together with 5 µM of PKA specific inhibitor H89 or 10 µM of MEK inhibitor U0126, and ERK1/2 phosphorylation was analyzed by Western blot. Expression was normalized to total ERK1/2, and each bar represents mean value ± SEM (n = 3). *, P<0.05 compared to untreated cells. #, P<0.05 compared to E2-treated Ishikawa cells.
Figure 5
Figure 5. ER-α36 mediates E2-stimulated cyclin D1 expression.
A. Western blot analysis of cyclin D1 and cdk4 expression in Ishikawa/V and Ishikawa/RNAiER36 cells treated with 10 nM E2 for 6 h and 12 h. Levels of cyclin D1 and cdk4 expression were normalized to the levels of β-actin, and each bar represents mean value ± SEM (n = 3). *, P<0.05 compared to untreated cells. #, P<0.05 compared to E2-treated Ishikawa/V cells. B. Ishikawa cells were treated for 12 h with E2 or together with 5 µM of PKCδ inhibitor rottlerin or 10 µM MEK inhibitor U0126. Levels of cyclin D1 and cdk4 expression were normalized to the levels of β-actin, and each bar represents mean value ± SEM (n = 3). *, P<0.05 compared to untreated cells. #, P<0.05 compared to E2-treated Ishikawa cells.
Figure 6
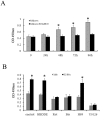
Figure 6. ER-a36 mediates E2 stimulated cell proliferation.
A. Ishikawa/V and Ishikawa/RNAiER36 cells were treated with 10 nM E2-BSA for 24 h, 48 h, 72 h and 96 h. MTT assay was performed as described in the materials and methods. Results of three independent experiments were averaged and mean value ± SEM are shown. *, P<0.05 compared to E2-BSA treated Ishikawa/V cells respectively. B. Ishikawa cells were treated with 10 nM E2-BSA alone or together with 5 µM rottlerin, a PKCδ specific inhibitor, or 5 µM bisindolylmaleimide, a pan-PKC inhibitor, or HBDDE, a PKCα specific inhibitor, or 5 µM H89, a PKA specific inhibitor for 72 h, and MTT assays were then performed. Results of three independent experiments were averaged and mean value ± SEM are shown. *, P<0.05 compared to control cells.

References

    1. Shang Y. Molecular mechanisms of oestrogen and SERMs in endometrial carcinogenesis. Nat Rev Cancer. 2006;6:360–368. - PubMed
    1. Chaudhry P, Asselin E. Resistance to chemotherapy and hormone therapy in endometrial cancer. Endocr Relat Cancer. 2009;16:363–380. - PubMed
    1. Henderson BE, Feigelson HS. Hormonal carcinogenesis. Carcinogenesis. 2000;21:427–433. - PubMed
    1. Muramatsu M, Inoue S. Estrogen receptors: how do they control reproductive and nonreproductive functions? Biochem Biophys Res Commun. 2000;270:1–10. - PubMed
    1. Zhang Y, Wei L, Wang J, Sun T. Role of phosphatase PTEN in the activation of extracellular signal-regulated kinases induced by estradiol in endometrial carcinoma cells. Chin Med J (Engl) 2003;116:383–387. - PubMed

Publication types

MeSH terms