

Review
doi: 10.1007/s10571-010-9569-x.
Epub 2010 Nov 16.
Paracrine role of GABA in adrenal chromaffin cells
Affiliations
- PMID: 21080062
- PMCID: PMC11498786
- DOI: 10.1007/s10571-010-9569-x
Item in Clipboard
Review
Paracrine role of GABA in adrenal chromaffin cells
Cell Mol Neurobiol.
2010 Nov.
Abstract
The function of GABA in the adrenal medulla is still controversial. We will review experimental results in vivo and in vitro in adrenal chromaffin cells of various mammals to clarify what has been elucidated and what still remains to be settled.
Figures

The presence of GABA signaling molecules in adrenal chromaffin cells. a Electrophoresis of PCR products for GAD67, GAD65, and β-actin. The PCR product of 280 bp for GAD67 was detected in cDNA samples of the rat brain (b) and adrenal medulla (m), but not in those of the adrenal cortex (c), whereas the PCR product of 338 bp for GAD65 was detected only in cDNA samples of the rat brain, but not of the adrenal medulla or adrenal cortex. Note that the 198 bp PCR products for β-actin were observed at similar levels in all three samples. s stands for standard ladder of DNAs. b Immunoblot analysis of fractionated bovine adrenal medulla for DβH, VGAT, synaptophysin (Syn), and early endosome antigen 1 (EEA1) with anti-DβH Ab (AB1538: Chemicon), anti-VGAT Ab (VGAT11-s: Alpha Diagnostic), anti-Syn Ab (sc-911: Santa Cruz), and anti-EEA1 Ab (sc-6414: Santa Cruz), respectively. Post-nuclear supernatants of bovine adrenal medulla were layered to the top of a discontinuous sucrose gradient from 10 to 65% in 5-point intervals, and ultracentrifuged at 5°C for 18 h. The same amount of proteins for each fraction was subjected to SDS-PAGE and immunoblotting. c Confocal fluorescence images of double immunostaining for VGAT and EEA1. Dissociated rat chromaffin cells were treated overnight with rabbit anti-VGAT Ab and goat anti-EEA1 Ab. Immunoreactivities to the former and the latter were visualized as FITC- and rhodamine-like fluorescence, respectively. The third image represents a merge of the first and the second image. The arrows indicate coincidence of both immunoreactivities. a Reproduced with modification from J Physiol (586: 4825–4842, 2008); b and c was from J Neurochem (114: 617–626, 2010)
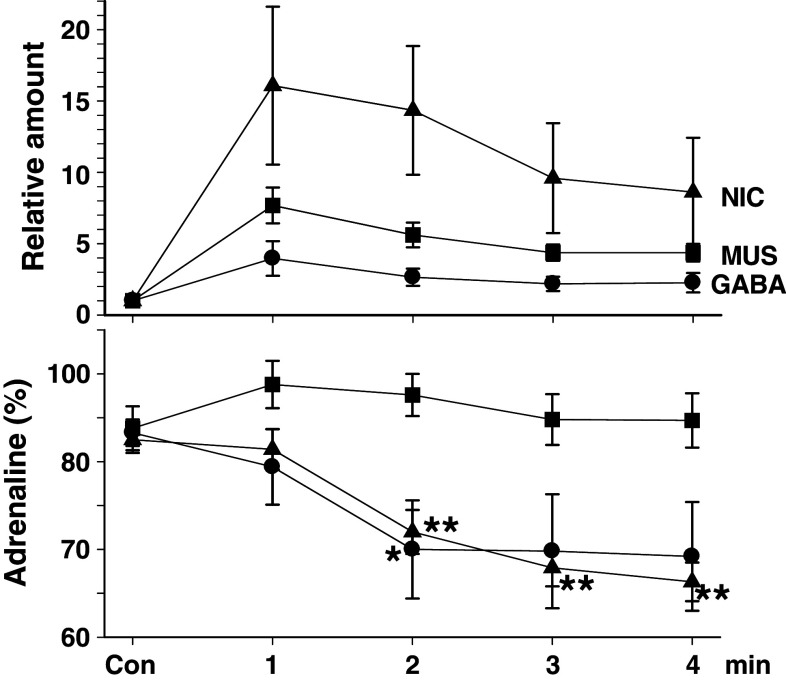
Secretion of catecholamine in response to nicotine, muscarine, and GABA in rat perfused adrenal medulla. Adrenal medulla was retrogradely perfused through the adrenal vein at a rate of 0.15 ml min−1. The perfusate was collected for every minute and subjected to measurement of adrenaline and noradrenaline with HPLC. The amount of catecholamine was expressed as a fraction of that (Con) before application of nicotine (Nic), muscarine (Mus), or GABA, each at 30 μM. The data represent means ± SEM of six samples. One and two asterisks indicate statistical significance of P < 0.05 and P < 0.01 with reference to each control level before application, respectively

Inhibitory effects of GABA on trans-synaptically evoked Ca2+ response in rat chromaffin cells. A Confocal images of fluo-4 fluorescence in rat adrenal medulla. The adrenal gland was retrogradely perfused with saline. The glands were subjected to a 40 min recurrent perfusion with 1 ml saline containing 10 μM fuo-4 AM and 0.2% Pluronic F 127. Then part of the adrenal cortex covering the medulla was removed by microcissors. The adrenal gland was placed between one pair of silver circles for electrical stimulation. Confocal images of FITC-like fluorescence were acquired every 5 s. B Relative values of change in fluorescence intensity are plotted against time. GABA at 30 μM was added to the perfusion solution during the period (interrupted line). Nerve fibers were electrically stimulated with 60 V pulses of 1.5 ms duration at 10 Hz for 30 s (bars). Fluorescence intensities in the areas (X and Y) indicated in Ac were measured and presented as filled (X) and open (Y) symbols, respectively. After correction for the decline due to photobleaching, an increase in fluorescence intensity to electrical stimulation and GABA was expressed as a fraction of the resting level. a, b, and c in A correspond to a, b and c in B. C Relative values of change in fluorescence intensity are plotted against time. Nerve fibers were electrically stimulated at 0.5, 1, and 5 Hz for 30 s in sequence before, during and after application of 30 μM GABA. D Summary of the overall Ca2+ responses to electrical stimulation with and without GABA application. The filled columns represent the maximum of the overall Ca2+ response to electrical stimulation and GABA. The open columns represent the maximum of the putative Ca2+ response to the electrical stimulation without GABA, a value which was estimated by averaging the maximum values of the electrically evoked Ca2+ responses before and after GABA application. The maximum of such Ca2+ responses with and without GABA application are expressed as a fraction of the Ca2+ response to electrical stimulation at each frequency before GABA application. * and ** represent statistical significance of P < 0.05 and P < 0.005, respectively. A, B, C, and D were reproduced from J Physiol (586:4825–4842, 2008)

Measurement of intracellular [Cl−] in rat chromaffin cells. a Actual traces of whole-cell currents in response to 30 μM GABA at various holding potentials indicated next to the traces. The whole cell currents were recorded using a perforated patch clamp technique. Gramicidin was added as the perforating agent to the pipette solution at final concentrations of 4–40 μg ml−1. b Peaks of GABA-induced currents are plotted against holding membrane potentials. c Summary of reversal potentials for GABA-induced currents under conditions where the pipette solution contained [Cl−] of 30 mM and 10 mM. The data represent means ± SEM of six and five experiments. a, b, and c were reproduced with modifications from J Physiol (586:4825–4842, 2008)

Summary of paracrine role of GAGA in adrenal chromaffin cells. Each half of GABAA receptors in rat chromaffin cells was estimated to contain either δ or γ2 subunit (Matsuoka et al. 2008)
Similar articles
-
Expression and distribution of GABA and GABAB-receptor in the rat adrenal gland.J Anat. 2014 Feb;224(2):207-15. doi: 10.1111/joa.12144. Epub 2013 Nov 20. J Anat. 2014. PMID: 24252118 Free PMC article.
-
Colocalization of gamma-aminobutyric acid immunoreactivity and acetylcholinesterase activity in nerve fibers of the mouse adrenal gland.J Vet Med Sci. 1999 Jun;61(6):631-5. doi: 10.1292/jvms.61.631. J Vet Med Sci. 1999. PMID: 10423684
-
Distribution of gamma-aminobutyric acid receptors in cultured adrenergic and noradrenergic bovine chromaffin cells.J Neurosci Res. 2003 Feb 1;71(3):375-82. doi: 10.1002/jnr.10488. J Neurosci Res. 2003. PMID: 12526026
-
Schwann cell precursors as a source for adrenal gland chromaffin cells.Cell Death Dis. 2017 Oct 5;8(10):e3072. doi: 10.1038/cddis.2017.456. Cell Death Dis. 2017. PMID: 28981120 Free PMC article. Review. No abstract available.
-
GPCRs of adrenal chromaffin cells & catecholamines: The plot thickens.Int J Biochem Cell Biol. 2016 Aug;77(Pt B):213-9. doi: 10.1016/j.biocel.2016.02.003. Epub 2016 Feb 3. Int J Biochem Cell Biol. 2016. PMID: 26851510 Review.
Cited by
-
GABA Signaling and Neuroactive Steroids in Adrenal Medullary Chromaffin Cells.Front Cell Neurosci. 2016 Apr 18;10:100. doi: 10.3389/fncel.2016.00100. eCollection 2016. Front Cell Neurosci. 2016. PMID: 27147972 Free PMC article. Review.
-
Effect of developmental NMDAR antagonism with CGP 39551 on aspartame-induced hypothalamic and adrenal gene expression.PLoS One. 2018 Mar 21;13(3):e0194416. doi: 10.1371/journal.pone.0194416. eCollection 2018. PLoS One. 2018. PMID: 29561882 Free PMC article.
-
Modulation of spontaneous intracellular Ca²⁺ fluctuations and spontaneous cholinergic transmission in rat chromaffin cells in situ by endogenous GABA acting on GABAA receptors.Pflugers Arch. 2016 Feb;468(2):351-65. doi: 10.1007/s00424-015-1744-y. Epub 2015 Oct 21. Pflugers Arch. 2016. PMID: 26490458
-
Developmental Changes in Gap Junction Expression in Rat Adrenal Medullary Chromaffin Cells.Acta Histochem Cytochem. 2024 Dec 20;57(6):189-197. doi: 10.1267/ahc.24-00033. Epub 2024 Dec 11. Acta Histochem Cytochem. 2024. PMID: 39776934 Free PMC article.
-
Neural circuit flexibility in a small sensorimotor system.Curr Opin Neurobiol. 2011 Aug;21(4):544-52. doi: 10.1016/j.conb.2011.05.019. Epub 2011 Jun 30. Curr Opin Neurobiol. 2011. PMID: 21689926 Free PMC article. Review.
References
-
- Annaert WG, Llona I, Backer AC, Jacob WA, De Potter WP (1993) Catecholamines are present in a synaptic-like microvesicle-enriched fraction from bovine adrenal medulla. J Neurochem 60:1746–1754 - PubMed
-
- Bauerfeind R, Régnier-Vigouroux A, Flatmark T, Huttner WB (1993) Selective storage of acetylcholine, but not catecholamines, in neuroendocrine synaptic-like microvesicles of early endosomal origin. Neuron 11:105–121 - PubMed
-
- Belelli D, Lambert JJ (2005) Neurosteroids: endogenous regulators of the GABAA receptor. Nat Rev Neurosci 6:565–575 - PubMed
Publication types
MeSH terms
Substances
LinkOut - more resources
Full Text Sources
