Comparative Study
. 2011 Apr;121(4):529-43.
doi: 10.1007/s00401-010-0773-z. Epub 2010 Nov 16.

Genome-wide comparison of paired fresh frozen and formalin-fixed paraffin-embedded gliomas by custom BAC and oligonucleotide array comparative genomic hybridization: facilitating analysis of archival gliomas

Affiliations
Comparative Study

Genome-wide comparison of paired fresh frozen and formalin-fixed paraffin-embedded gliomas by custom BAC and oligonucleotide array comparative genomic hybridization: facilitating analysis of archival gliomas

Gayatry Mohapatra et al. Acta Neuropathol. 2011 Apr.

Abstract

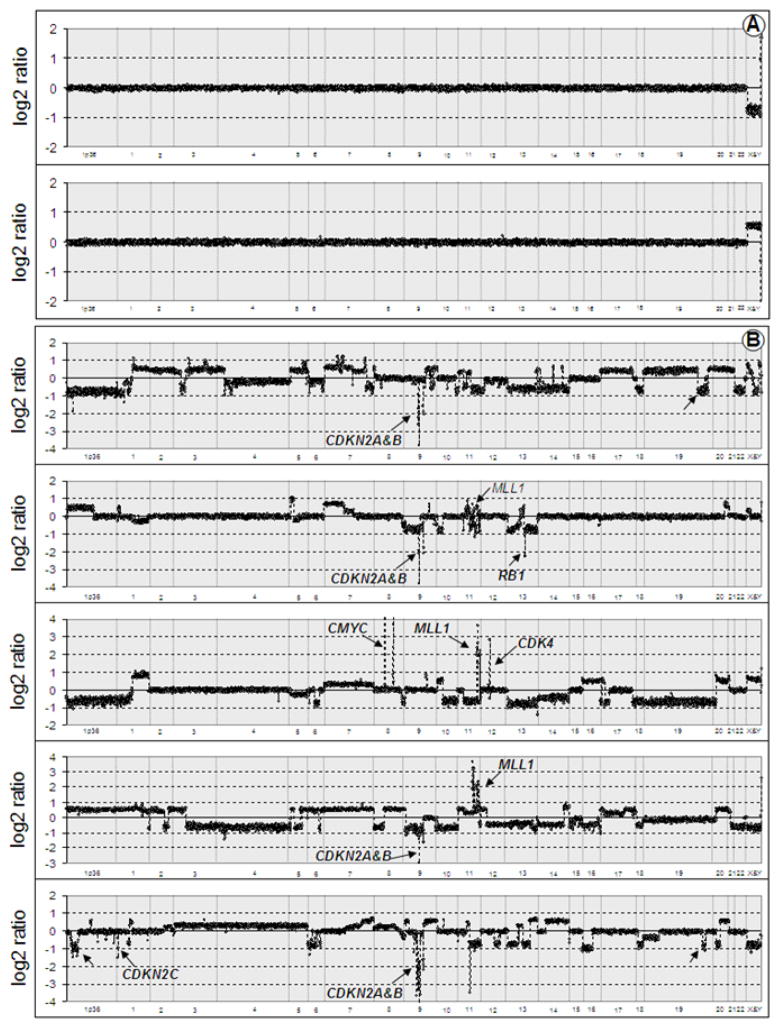
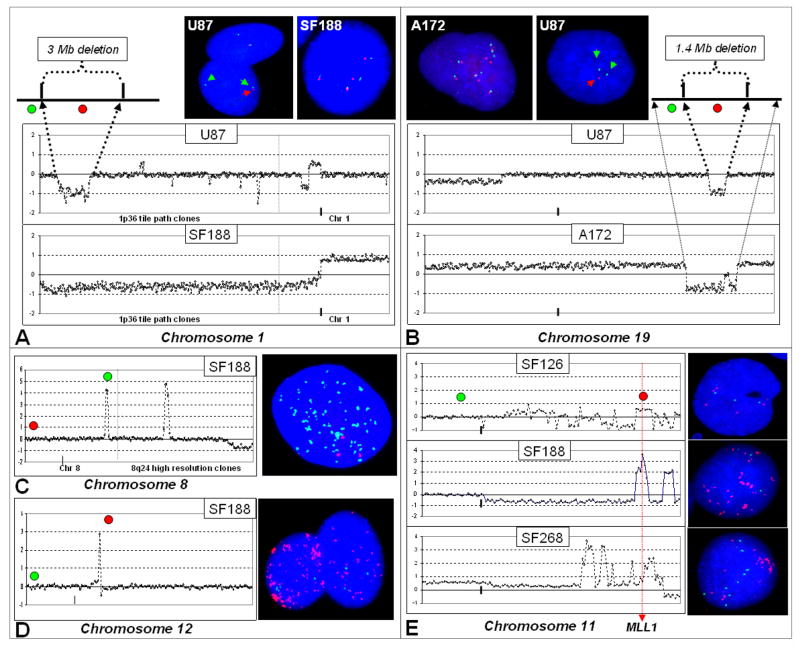
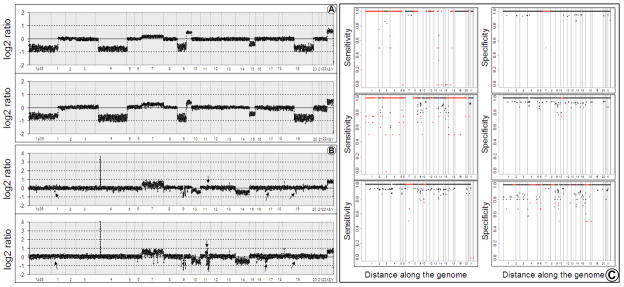
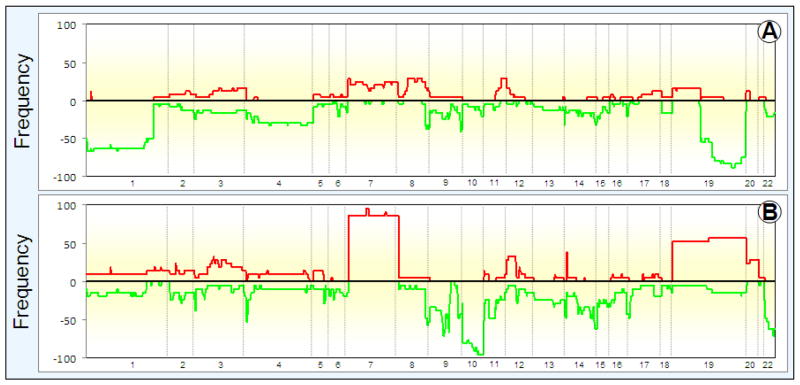
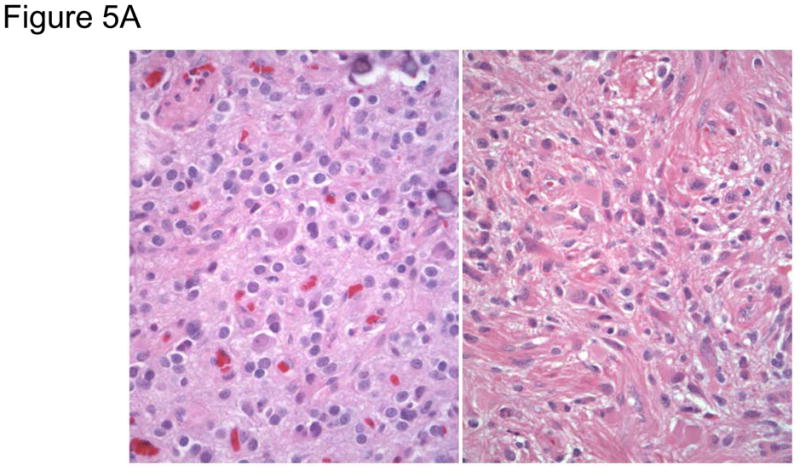
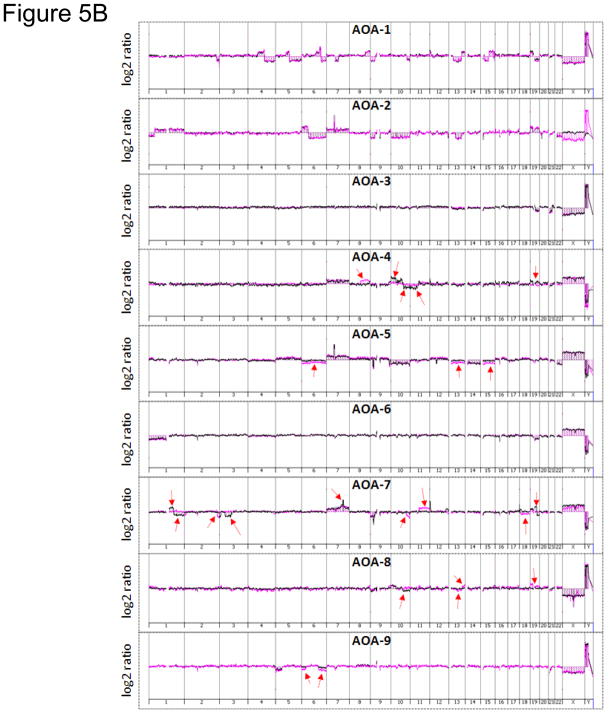
Array comparative genomic hybridization (aCGH) is a powerful tool for detecting DNA copy number alterations (CNA). Because diffuse malignant gliomas are often sampled by small biopsies, formalin-fixed paraffin-embedded (FFPE) blocks are often the only tissue available for genetic analysis; FFPE tissues are also needed to study the intratumoral heterogeneity that characterizes these neoplasms. In this paper, we present a combination of evaluations and technical advances that provide strong support for the ready use of oligonucleotide aCGH on FFPE diffuse gliomas. We first compared aCGH using bacterial artificial chromosome (BAC) arrays in 45 paired frozen and FFPE gliomas, and demonstrate a high concordance rate between FFPE and frozen DNA in an individual clone-level analysis of sensitivity and specificity, assuring that under certain array conditions, frozen and FFPE DNA can perform nearly identically. However, because oligonucleotide arrays offer advantages to BAC arrays in genomic coverage and practical availability, we next developed a method of labeling DNA from FFPE tissue that allows efficient hybridization to oligonucleotide arrays. To demonstrate utility in FFPE tissues, we applied this approach to biphasic anaplastic oligoastrocytomas and demonstrate CNA differences between DNA obtained from the two components. Therefore, BAC and oligonucleotide aCGH can be sensitive and specific tools for detecting CNAs in FFPE DNA, and novel labeling techniques enable the routine use of oligonucleotide arrays for FFPE DNA. In combination, these advances should facilitate genome-wide analysis of rare, small and/or histologically heterogeneous gliomas from FFPE tissues.


Figures

Figure 1
Figure 1. Measurement of detection sensitivity of the BAC array
A) aCGH of normal male and female lymphocyte DNA. aCGH was performed using normal male and female lymphocyte DNA from 4 healthy donors that were used as reference for all tumors. The upper panel shows the profiles of male DNA labeled in Cy3-dCTP and female DNA labeled in Cy5-dCTP and lower panel shows the profiles of female DNA labeled in Cy3-dCTP and male DNA labeled in Cy5-dCTP, by random priming. Normalized log2 ratio of medians along the autosomes were close to 0, indicating normal DNA copy number, and along the X chromosome were − 0.5, and 1.5 indicating apparent loss or gain (from gender mismatch). B) aCGH profiles of DNA from GBM cell lines A172, SF126, SF188, SF268 and U87 used to measure the detection sensitivity/limits of the array. These cell lines were previously analyzed using conventional CGH (27). Comparison of aCGH data with the conventional CGH data shows that all previously reported CNAs were identified (including known genes, labeled arrows) but with a higher degree of precision (Table 1). Several CNAs that were previously not reported were also detected (unlabeled arrows).
Figure 2
Figure 2. Validation of aCGH by FISH
A) To assess the detection limits of the array, FISH was performed using locus specific probes at 5 loci. aCGH detected a 3Mb interstitial deletion along 1p36 in U87 and loss of entire 1p in SF188. FISH was performed on the respective cells using RP5-1092A11 which maps with in the 3 Mb deleted region was labeled in Cy3-dUTP and RP11-181G12 which maps upstream of the deletion was labeled in FITC-dUTP. In U87, 1 red and 2 green spots were detected, confirming the interstitial deletion, whereas in SF188 equal numbers of red and green spots were observed because all of 1p is deleted. B) aCGH showed a 1.4 Mb deletion in U87 and 7.2 Mb deletion (includes two adjacent interstitial deletions) in A172 on 19q13.3. FISH was performed using CTD-2571L23, which maps with in the 1.4 Mb deleted region, labeled in Cy3-dUTP and RP11-210G11, which maps upstream of the smaller deletion but with in the 7.2 Mb deleted region, labeled in FITC-dUTP. In U87, 1 red and 2 green spots were detected, confirming the interstitial deletion, whereas in A172 an equal number of red and green spots were detected, confirming that the 7.2 Mb deletion is occurring in a polysomic chromosome 19 background. C) aCGH detected the known amplification of CMYC at 8q24.12 in SF188. This was confirmed by FISH using CMYC specific BAC clone CTD-3056O22, labeled in FITC-dUTP and RP11-11P7, labeled in Cy3-dUTP, mapping to 8p23.2 as control. D) aCGH illustrates a previously unreported amplification on 12q14 in SF188. This was confirmed by FISH using BAC clone CTD-2287P13 labeled in Cy3-dUTP and RP11-87C2 labeled in FITC-dUTP. Further analysis using end-sequences from CTD-2287P13 indicated CDK4, MARCH9 and METTL1 genes to be contained with in the BAC. E) aCGH highlights a highly rearranged chromosome 11 in SF126, and multiple amplifications in SF188 and SF268. SF268 has been reported to have 2 adjacent amplifications on 11q (27). Our results indicate that there are at least 5 high level amplifications in SF268 along 11q22-q24.1. Comparison of chromosome 11 profiles in these 3 cell lines defined a common region of amplification along 11q23.3 containing the MLL1 gene. This was confirmed by FISH using a MLL1 specific BAC clone RP11-770J1, labeled in Cy3-dUTP and RP11-58K22 on 11p11.2 labeled in FITC-dUTP as control.
Figure 3
Figure 3. Comparative analysis of aCGH profiles of paired frozen and FFPE samples
A) The two upper panels represent aCGH profiles of frozen and FFPE DNA for xT2500, with perfect concordance in CNAs between frozen and FFPE DNA for this sample. B) The two lower panels represent frozen and FFPE profiles for xT3491 DNA with small regions of disagreement indicated by arrows. C) Evaluation of sensitivity and specificity of CNAs detected in paired frozen and FFPE samples. The top two panels illustrate sensitivity and specificity relative to gain; the middle two panels illustrate sensitivity and specificity relative to loss; and the bottom panels illustrate sensitivity and specificity relative to no change in DNA copy number. The top line (1.0) indicates markers with perfect concordance, with points below 1.0 representing BACs with less concordance. Red points are sensitivity and specificity based on fewer than five gold-standard (i.e., frozen) events. The panels demonstrate excellent comparative sensitivity and specificity at the vast majority of loci (see text).
Figure 4
Figure 4. Frequency of gain and loss of DNA copy numbers in gliomas
A) Summary of CNAs in 24 oligodendrogliomas. B) Summary of CNAs in 21 GBMs. The X-axis represents the BAC clones from 1pter to 22qter. The Y axis represents the frequency of CNA, with gains in red above the baseline, and losses in green below the baseline.
Figure 5
Figure 5
A) H&E staining of a biphasic AOA. Left panel shows oligodendroglial and right panel shows astrocytic differentiation (400X magnification). B) Oligonucleotide aCGH profiles of biphasic AOAs from FFPE DNA. Genomic profiles of AOAs 1–9 were generated using modified labeling protocol show superior quality hybridization due to uniform representation of tumor DNA in the probe mixture. Differences between the two components are shown in red arrows.
Figure 5
Figure 5
A) H&E staining of a biphasic AOA. Left panel shows oligodendroglial and right panel shows astrocytic differentiation (400X magnification). B) Oligonucleotide aCGH profiles of biphasic AOAs from FFPE DNA. Genomic profiles of AOAs 1–9 were generated using modified labeling protocol show superior quality hybridization due to uniform representation of tumor DNA in the probe mixture. Differences between the two components are shown in red arrows.

Similar articles

Cited by

References

    1. Bejjani BA, Shaffer LG. Clinical utility of contemporary molecular cytogenetics. Annu Rev Genomics Hum Genet. 2008;9:71–86. - PubMed
    1. Bredel M, Scholtens DM, Harsh GR, Bredel C, Chandler JP, Renfrow JJ, Yadav AK, Vogel H, Scheck AC, Tibshirani R, Sikic BI. A network model of a cooperative genetic landscape in brain tumors. Jama. 2009;302:261–275. - PMC - PubMed
    1. Brennan C, Momota H, Hambardzumyan D, Ozawa T, Tandon A, Pedraza A, Holland E. Glioblastoma subclasses can be defined by activity among signal transduction pathways and associated genomic alterations. PLoS One. 2009;4:e7752. - PMC - PubMed
    1. Bussey KJ, Chin K, Lababidi S, Reimers M, Reinhold WC, Kuo WL, Gwadry F, Ajay, Kouros-Mehr H, Fridlyand J, Jain A, Collins C, Nishizuka S, Tonon G, Roschke A, Gehlhaus K, Kirsch I, Scudiero DA, Gray JW, Weinstein JN. Integrating data on DNA copy number with gene expression levels and drug sensitivities in the NCI-60 cell line panel. Mol Cancer Ther. 2006;5:853–867. - PMC - PubMed
    1. Cai WW. Detection of DNA copy-number alterations in complex genomes using array comparative genomic hybridization. Methods Mol Biol. 2007;381:105–119. - PubMed

Publication types

MeSH terms