. 2010 Nov 16:9:73.
doi: 10.1186/1475-925X-9-73.

Effective radiation attenuation calibration for breast density: compression thickness influences and correction

Affiliations

Effective radiation attenuation calibration for breast density: compression thickness influences and correction

John J Heine et al. Biomed Eng Online. .

Abstract

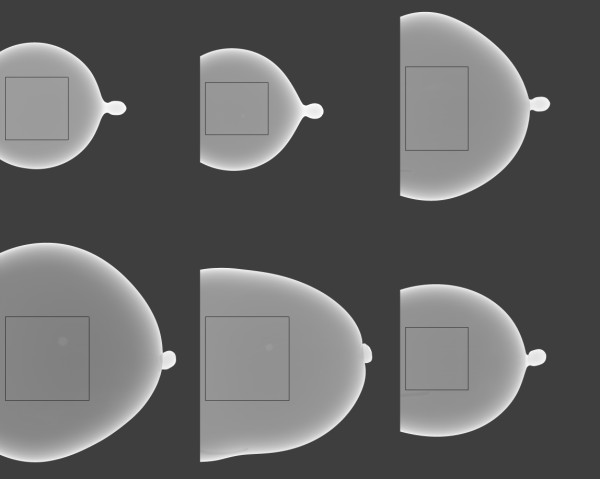
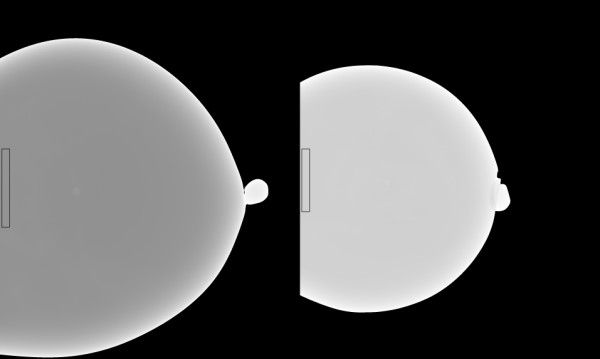
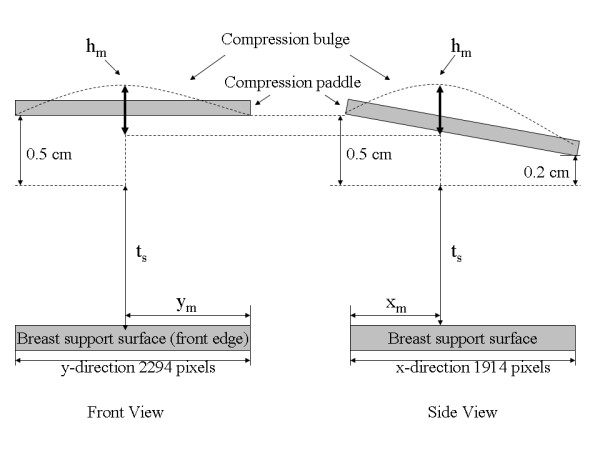
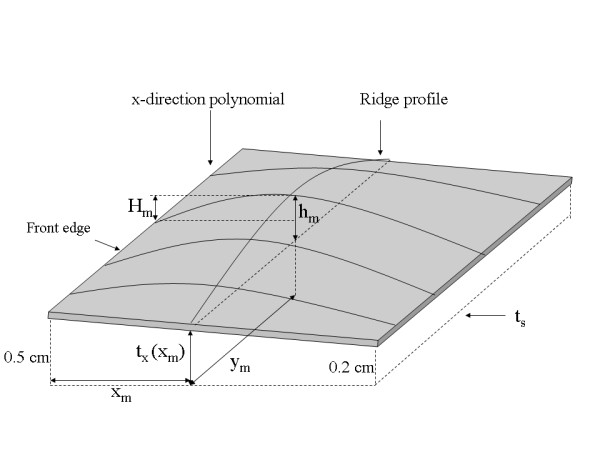
Background: Calibrating mammograms to produce a standardized breast density measurement for breast cancer risk analysis requires an accurate spatial measure of the compressed breast thickness. Thickness inaccuracies due to the nominal system readout value and compression paddle orientation induce unacceptable errors in the calibration.

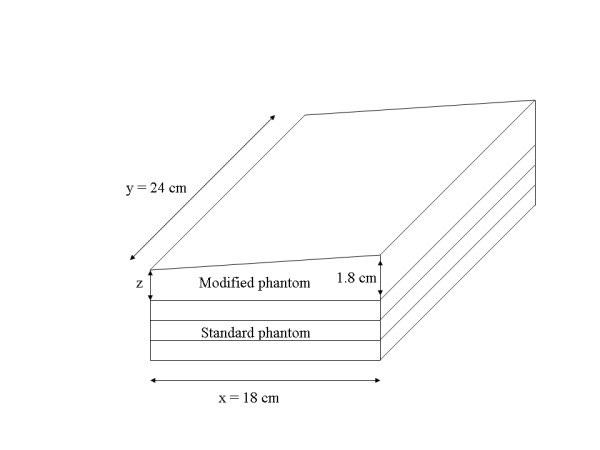
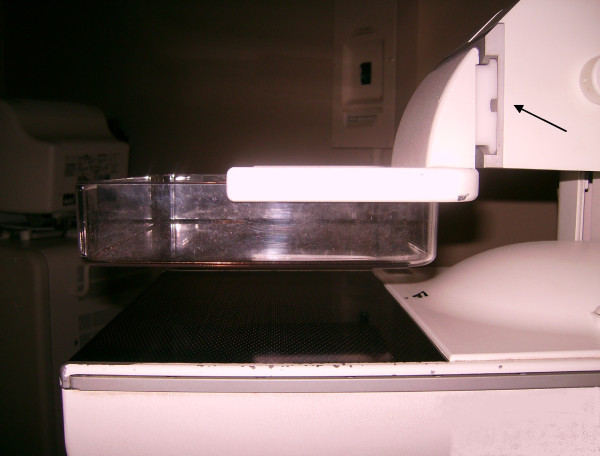
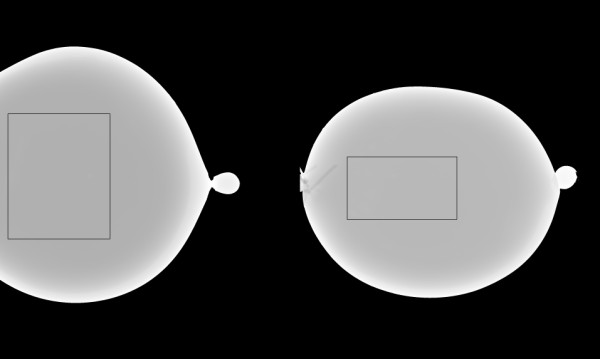
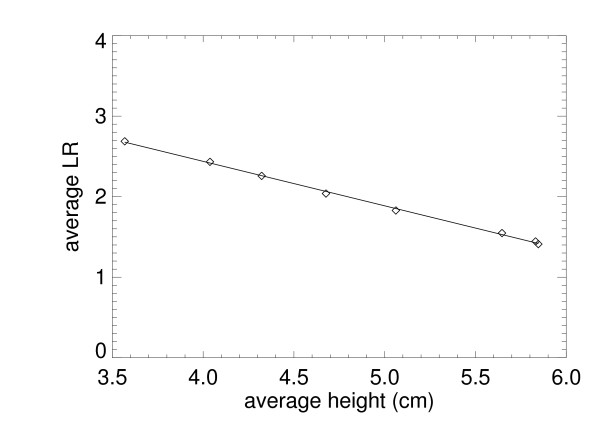
Method: A thickness correction was developed and evaluated using a fully specified two-component surrogate breast model. A previously developed calibration approach based on effective radiation attenuation coefficient measurements was used in the analysis. Water and oil were used to construct phantoms to replicate the deformable properties of the breast. Phantoms consisting of measured proportions of water and oil were used to estimate calibration errors without correction, evaluate the thickness correction, and investigate the reproducibility of the various calibration representations under compression thickness variations.

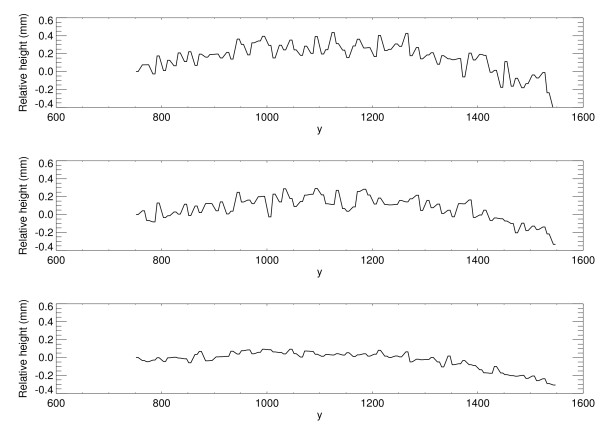
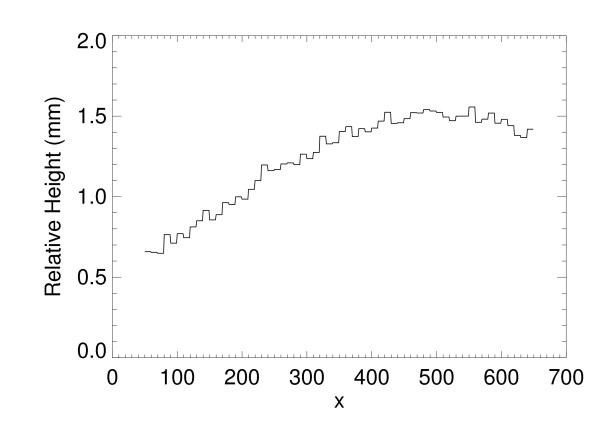
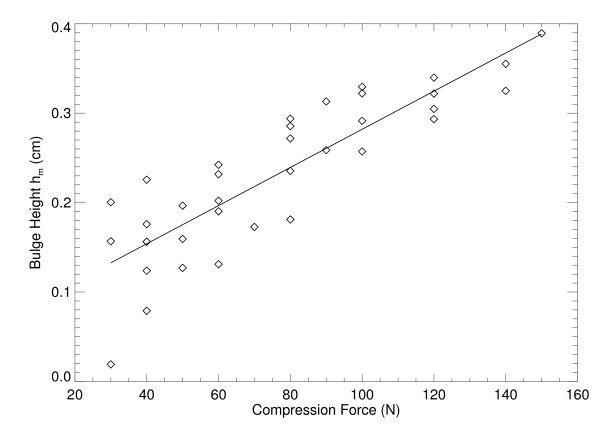
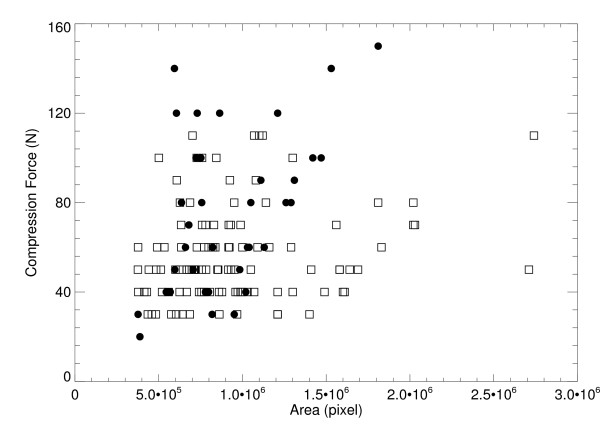
Results: The average thickness uncertainty due to compression paddle warp was characterized to within 0.5 mm. The relative calibration error was reduced to 7% from 48-68% with the correction. The normalized effective radiation attenuation coefficient (planar) representation was reproducible under intra-sample compression thickness variations compared with calibrated volume measures.

Conclusion: Incorporating this thickness correction into the rigid breast tissue equivalent calibration method should improve the calibration accuracy of mammograms for risk assessments using the reproducible planar calibration measure.


Figures

Figure 1
Figure 1
Modified breast tissue equivalent phantoms. This illustration shows a modified phantom (top) stacked upon three standard phantoms. These modifications give a constant height gradient = z/1800 (mm/pixel) in the x-direction for z ranging from 1-4 mm (in 1 mm increments).
Figure 2
Figure 2
Set of six water filled phantoms. These phantoms were used to assess the compressed sample thickness variation as a function of compression force range. Thirty-five images were acquired from these six phantoms over a range of compression forces. The system readout thicknesses for these displayed examples were between 3-4 cm.
Figure 3
Figure 3
Compression paddle. The paddle is in the relaxed mode. Play in the connection (arrow) allows the paddle to tilt upward (front of the detector) when there is upward resistance to the downward compression force. The sidewalls add to the paddle perimeter rigidity.
Figure 4
Figure 4
Reference phantoms. The water (left) and oil (right) phantoms were used as calibration references. Calibration parameters were generated from the outlined strips near the detector edge of 50 ×500 pixels (water) and 50 × 400 pixels (oil) to eliminate compression thickness uncertainty.
Figure 5
Figure 5
Compression paddle perimeter-breast support surface illustration. Various distances for the paddle perimeter assessments are illustrated with an arbitrary bulge. Adding 0.5 cm to the system compression thickness readout value, ts , gives the corrected height along the front edge of the breast support surface (left figure). The right figure shows the paddle tilt along the x-direction relative to ts. The paddle maximum bulge height (hm), located at (xm, ym) was estimated relative to paddle-perimeter height at × = xm for each of the phantom images that are summarized in Table 2.
Figure 6
Figure 6
Compression paddle deformed front-edge profiles. Three one-dimension compression paddle profiles along y-direction at × = 20 are shown, which were estimated by modifying Eq. (11) to analyze bulge along the y-direction near the paddle front perimeter. The paddle perimeter flex is less than 0.4 mm. The compression forces (dN) were 4.0, 6.0, and 8.0 from top to bottom, respectively.
Figure 7
Figure 7
The correction model. All relevant measured distances, positions, ridge-profile, and separable x-direction polynomials are labeled on this correction surface illustration. The dashed line represents system thickness readout plane with ts (system readout height) parallel to the breast support surface. The ridge-profile runs along the y-direction at × = xm with a maximum height hm located at (xm, ym) measured above the perimeter height at xm. Hm is the height above ts +0.5 cm measured from H(x, y) that was used to derive hm. A given x-direction polynomial was constructed with the position and height of the ridge-profile at the intersection of the two polynomials along with the relative paddle parameter heights at × = 0 and × = xmax, which are 0.5 cm and 0.2 cm, respectively.
Figure 8
Figure 8
Surface Profile. This shows one dimensional H(x, y) profile through the maximum bulge height, Hm (as well as hm) along the x-direction. The system thickness readout value was 3.2 cm with 7 dN compression force.
Figure 9
Figure 9
Bulge height regression. This shows the fitted (solid) linear relationship between the maximum bulge height (diamonds) as a function of compression force for the 35 water filled phantom images.
Figure 10
Figure 10
Compression force contact area comparison. This shows the force and contact area comparison for the study mammograms (squares) compared with the deformable water phantoms (filled circles) summarized in Table 3.
Figure 11
Figure 11
Deformable mixture phantom examples. The 34/66 (water/oil) mixture is shown on the left and the 31/69 mixture on the right. The calibration application was constrained to the outlined regions to avoid curvature effects. These regions are 650 ×800 pixels and 700 × 400 pixels, respectively.
Figure 12
Figure 12
Water/oil mixture calibration region example. The 650 × 800 pixel region of interest outlined in Figure 11 (left image) is shown (34/66 mixture). The left figure shows the raw pixel value representation and the right figure shows the calibrated representation. For reference, percent glandular (PG) = 32-34 in the pronounced darker regions and PG = 36-37 in the lighter regions in the right figure. These slight variations are due to water-oil separation; the perceived contrast is due to the overall uniform contrast of the larger background area and does not represent large pixel value differences. The checking is due to the coarse resolution of the mapping.
Figure 13
Figure 13
The average logarithmic response (LR) is plotted (diamonds) for the 34/66 mixture (example # 2) taken over 25 cm2 region for each height and compared with the regression fitted line (solid) . The horizontal axis is the average corrected thickness for each region. The absolute value of the regression slope, 0.546 ± 0.01, is the effective radiation attenuation coefficient for the mixture. Letting p = 0.34, μe = 0.34 × μw + 0.66 × μo = 0.543, which was derived with the values from Table 4.

References

    1. Boyd NF, Rommens JM, Vogt K, Lee V, Hopper JL, Yaffe MJ, Paterson AD. Mammographic breast density as an intermediate phenotype for breast cancer. Lancet Oncol. 2005;6:798–808. doi: 10.1016/S1470-2045(05)70390-9. - DOI - PubMed
    1. McCormack VA, dos Santos Silva I. Breast density and parenchymal patterns as markers of breast cancer risk: a meta-analysis. Cancer Epidemiol Biomarkers Prev. 2006;15:1159–1169. doi: 10.1158/1055-9965.EPI-06-0034. - DOI - PubMed
    1. Boyd NF, Guo H, Martin LJ, Sun L, Stone J, Fishell E, Jong RA, Hislop G, Chiarelli A, Minkin S, Yaffe MJ. Mammographic density and the risk and detection of breast cancer. N Engl J Med. 2007;356:227–236. doi: 10.1056/NEJMoa062790. - DOI - PubMed
    1. Byng JW, Boyd NF, Fishell E, Jong RA, Yaffe MJ. The quantitative analysis of mammographic densities. Phys Med Biol. 1994;39:1629–1638. doi: 10.1088/0031-9155/39/10/008. - DOI - PubMed
    1. Boyd NF, Byng JW, Jong RA, Fishell EK, Little LE, Miller AB, Lockwood GA, Tritchler DL, Yaffe MJ. Quantitative classification of mammographic densities and breast cancer risk: results from the Canadian National Breast Screening Study. J Natl Cancer Inst. 1995;87:670–675. doi: 10.1093/jnci/87.9.670. - DOI - PubMed

Publication types