Comparative Study
. 2010 Nov 16;12(1):67.
doi: 10.1186/1532-429X-12-67.

Acoustic cardiac triggering: a practical solution for synchronization and gating of cardiovascular magnetic resonance at 7 Tesla

Affiliations
Comparative Study

Acoustic cardiac triggering: a practical solution for synchronization and gating of cardiovascular magnetic resonance at 7 Tesla

Tobias Frauenrath et al. J Cardiovasc Magn Reson. .

Abstract

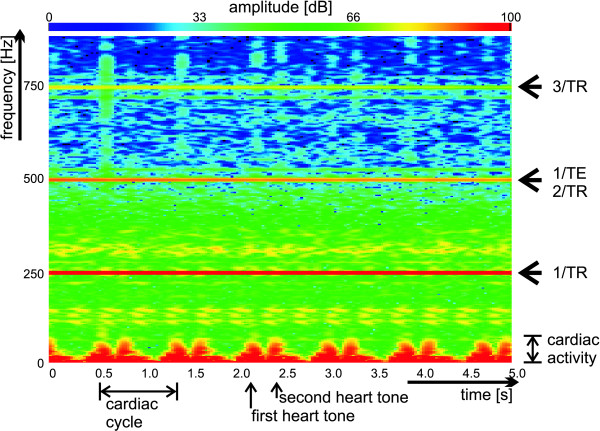
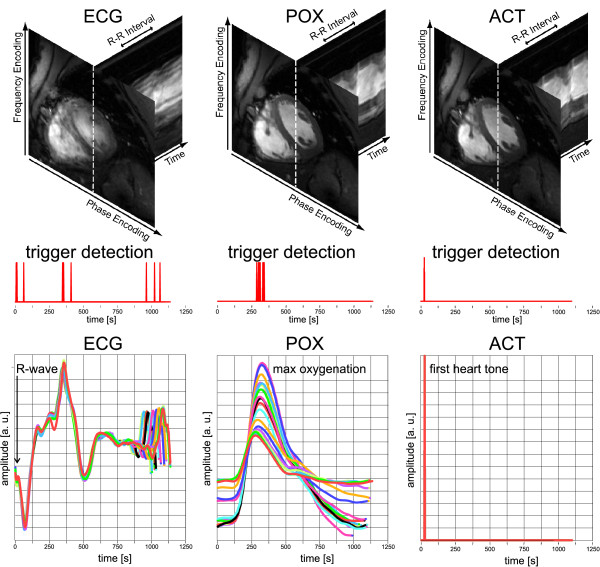
Background: To demonstrate the applicability of acoustic cardiac triggering (ACT) for imaging of the heart at ultrahigh magnetic fields (7.0 T) by comparing phonocardiogram, conventional vector electrocardiogram (ECG) and traditional pulse oximetry (POX) triggered 2D CINE acquisitions together with (i) a qualitative image quality analysis, (ii) an assessment of the left ventricular function parameter and (iii) an examination of trigger reliability and trigger detection variance derived from the signal waveforms.

Results: ECG was susceptible to severe distortions at 7.0 T. POX and ACT provided waveforms free of interferences from electromagnetic fields or from magneto-hydrodynamic effects. Frequent R-wave mis-registration occurred in ECG-triggered acquisitions with a failure rate of up to 30% resulting in cardiac motion induced artifacts. ACT and POX triggering produced images free of cardiac motion artefacts. ECG showed a severe jitter in the R-wave detection. POX also showed a trigger jitter of approximately Δt = 72 ms which is equivalent to two cardiac phases. ACT showed a jitter of approximately Δt = 5 ms only. ECG waveforms revealed a standard deviation for the cardiac trigger offset larger than that observed for ACT or POX waveforms.Image quality assessment showed that ACT substantially improved image quality as compared to ECG (image quality score at end-diastole: ECG = 1.7 ± 0.5, ACT = 2.4 ± 0.5, p = 0.04) while the comparison between ECG vs. POX gated acquisitions showed no significant differences in image quality (image quality score: ECG = 1.7 ± 0.5, POX = 2.0 ± 0.5, p = 0.34).

Conclusions: The applicability of acoustic triggering for cardiac CINE imaging at 7.0 T was demonstrated. ACT's trigger reliability and fidelity are superior to that of ECG and POX. ACT promises to be beneficial for cardiovascular magnetic resonance at ultra-high field strengths including 7.0 T.


Figures

Figure 1
Figure 1
Acoustic Spectrogram obtained at 7.0 T. Spectrogram obtained from a subject positioned at the 7.0 T magnet's isocenter during 2D CINE FLASH acquisitions (TE = 2.0 ms, TR = 4.0 ms). The graphs show signal contributions from gradient switching superimposed on the cardiac signals. The gradient switching manifests itself by several very sharp harmonic components at 1/TR, 2/TR, 3/TR and 1/TE with maximum sound pressure level close to 120 dB. The spectrogram also shows the 1st and the 2nd heart tone which are of low-frequency nature. Acoustic signal-to-noise ratio, which is defined as the ratio between the sound pressure level due to cardiac activity and the gradient switching induced sound pressure level is approximately 30 dB for the frequency range between 10 Hz and 70 Hz.
Figure 2
Figure 2
ECG, pulse oximetry and acoustic trigger signal traces acquired at three different field strengths. ECG (top), pulse oximetry (middle) and acoustic trigger (bottom) signal traces derived from a healthy subject. Signal traces were recorded with the ECG, ACT and POX sensors located at the patient table home position (left), at the front end of the 7.0 T magnet (center) and in the isocenter of the 7.0 T magnet (right) and post-processed and filtered by the scanners central physiological monitoring unit. Severe signal distortion occurred in the vector ECG signal obtained at the magnet's isocenter. A scatter in the amplitude and width was observed for the peak in the pulse oximetry trace. ACT is free of interferences with electromagnetic fields and magneto-hydrodynamic effects.
Figure 3
Figure 3
Short axis diastolic views free of cardiac motion effects. Short axis diastolic views obtained from breath-held base-to-apex 2D CINE FLASH acquisitions using (top) vector ECG, (middle) ACT and POX (bottom) gating. In this case of correct R-wave detection (subject 1), ECG-gated 2D CINE FLASH imaging was found to be immune to cardiac motion effects, as were ACT and POX gated acquisitions.
Figure 4
Figure 4
Short axis diastolic views showing cardiac motion artifacts when using ECG gating. Short axis diastolic views obtained from breath-held apex-to-base 2D CINE FLASH acquisitions using (top) vector ECG, (middle) ACT and POX (bottom) gating. In this subject (subject 2) vector ECG triggered 2D CINE FLASH imaging was prone to severe cardiac motion artifacts if R-wave mis-registration occurred. Images suffering from cardiac motion induced blurring are marked with grey bars. Acoustic triggering and POX provided image quality free of interferences from cardiac motion effects.
Figure 5
Figure 5
Example of correct ECG trigger detection. Cardiac images, trigger detection tickmarks and signal waveforms obtained at 7.0 T using vector ECG (left), pulse oximetry (center) and acoustically triggered (right) 2D CINE FLASH acquisitions. All signal waveforms show the output of the scanners central physiological monitoring unit (including processing of the ECG, POX and ACT signal) as displayed at the scanners user interface. Top: Mid-ventricular, short axis views of the heart together with whole R-R interval time series of one-dimensional projections along the profile (dotted line) marked in the short axis view. Middle: Trigger detection tickmarks obtained from a single subject over 18 cardiac cycles after temporal realignment using cross correlation and reassignment. Bottom: Signal waveforms obtained from a single subject (subject 1) over 18 cardiac cycles. In spite of vector ECG's severe signal distortion faultless vector ECG triggering was observed for this example. Hence, in this example of correct recognition of the onset of cardiac activity, vector ECG, POX and ACT triggered 2D CINE FLASH imaging were found to be immune to the effects of cardiac motion. Please note the jitter in the vector ECG (Δt = 60 ms) and in the pulse oximetry trigger (Δt = 65 ms)detection.
Figure 6
Figure 6
Example of erroneous ECG trigger detection. Cardiac images, trigger detection tickmarks and signal waveforms obtained at 7.0 T using vector ECG (left), pulse oximetry (center) and acoustically triggered (right) 2D CINE FLASH acquisitions. All signal waveforms show the output of the scanners central physiological monitoring unit (including processing of the ECG, POX and ACT signal) as displayed at the scanners user interface. Top: Mid-ventricular, short axis views of the heart together with whole R-R interval time series of one-dimensional projections along the profile (dotted line) marked in the short axis view. Middle: Trigger detection tickmarks obtained from a single subject over 18 cardiac cycles after temporal realignment using cross correlation and reassignment. Bottom: Signal waveforms obtained from a single subject (subject 2) over 18 cardiac cycles. In this example vector ECG triggered CINE imaging was prone to severe cardiac motion artifacts due to R wave mis-registration which induced reduction in myocardium/blood contrast and image sharpness. ACT triggered 2D CINE FLASH imaging provided faultless trigger detection and hence produced images free of motion artifacts. Please note the scatter in the POX peak amplitude and peak width, causing a jitter (Δt = 72 ms) in the pulse oximetry trigger detection which constituted a synchronization problem.
Figure 7
Figure 7
Comparison of cardiac chamber quantification parameters obtained for three triggering methods. Bland-Altman plots showing for each subject the mean of two measurements (ACT vs ECG, ACT vs POX and ECG vs POX) and the difference in the left ventricular parameter derived from vector ECG, ACT and POX gated 2D CINE FLASH acquisitions at 7.0 T. Dashed black lines in the Bland-Altman plots represent the mean difference while the dotted lines embody the confidence interval which was set to the mean value ± 1.96 of the standard.

Similar articles

Cited by

References

    1. Lanzer P, Botvinick EH, Schiller NB, Crooks LE, Arakawa M, Kaufman L, Davis PL, Herfkens R, Lipton MJ, Higgins CB. Cardiac imaging using gated magnetic resonance. Radiology. 1984;150:121–127. - PubMed
    1. Brau AC, Wheeler CT, Hedlund LW, Johnson GA. Fiber-optic stethoscope: a cardiac monitoring and gating system for magnetic resonance microscopy. Magn Reson Med. 2002;47:314–321. doi: 10.1002/mrm.10049. - DOI - PubMed
    1. Pattynama PM, van der Velde ET, Steendijk P, Lamb HJ, Baan J, de Roos A. Cardiovascular MR imaging: pressure-gating using the arterial pressure signal from a conventional ferromagnetic micromanometer-tip catheter. Magn Reson Imaging. 1994;12:531–534. doi: 10.1016/0730-725X(94)92547-X. - DOI - PubMed
    1. Rubin JM, Fowlkes JB, Prince MR, Rhee RT, Chenevert TL. Doppler US gating of cardiac MR imaging. Acad Radiol. 2000;7:1116–1122. doi: 10.1016/S1076-6332(00)80065-3. - DOI - PubMed
    1. Buikman D, Helzel T, Roschmann P. The rf coil as a sensitive motion detector for magnetic resonance imaging. Magn Reson Imaging. 1988;6:281–289. doi: 10.1016/0730-725X(88)90403-1. - DOI - PubMed

Publication types