

Local topographic wetness indices predict household malaria risk better than land-use and land-cover in the western Kenya highlands
- PMID: 21080943
- PMCID: PMC2993734
- DOI: 10.1186/1475-2875-9-328
Local topographic wetness indices predict household malaria risk better than land-use and land-cover in the western Kenya highlands
Abstract
Background: Identification of high-risk malaria foci can help enhance surveillance or control activities in regions where they are most needed. Associations between malaria risk and land-use/land-cover are well-recognized, but these environmental characteristics are closely interrelated with the land's topography (e.g., hills, valleys, elevation), which also influences malaria risk strongly. Parsing the individual contributions of land-cover/land-use variables to malaria risk requires examining these associations in the context of their topographic landscape. This study examined whether environmental factors like land-cover, land-use, and urban density improved malaria risk prediction based solely on the topographically-determined context, as measured by the topographic wetness index.
Methods: The topographic wetness index, an estimate of predicted water accumulation in a defined area, was generated from a digital terrain model of the landscape surrounding households in two neighbouring western Kenyan highland communities. Variables determined to best encompass the variance in this topographic wetness surface were calculated at a household level. Land-cover/land-use information was extracted from a high-resolution satellite image using an object-based classification method. Topographic and land-cover variables were used individually and in combination to predict household-level malaria in the communities through an iterative split-sample model fitting and testing procedure. Models with only topographic variables were compared to those with additional predictive factors related to land-cover/land-use to investigate whether these environmental factors improved prediction of malaria based on the shape of the land alone.
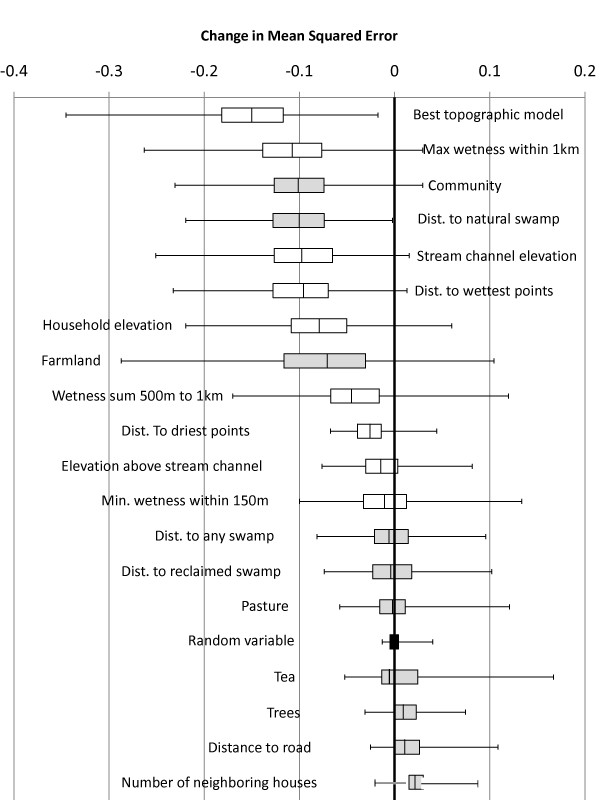
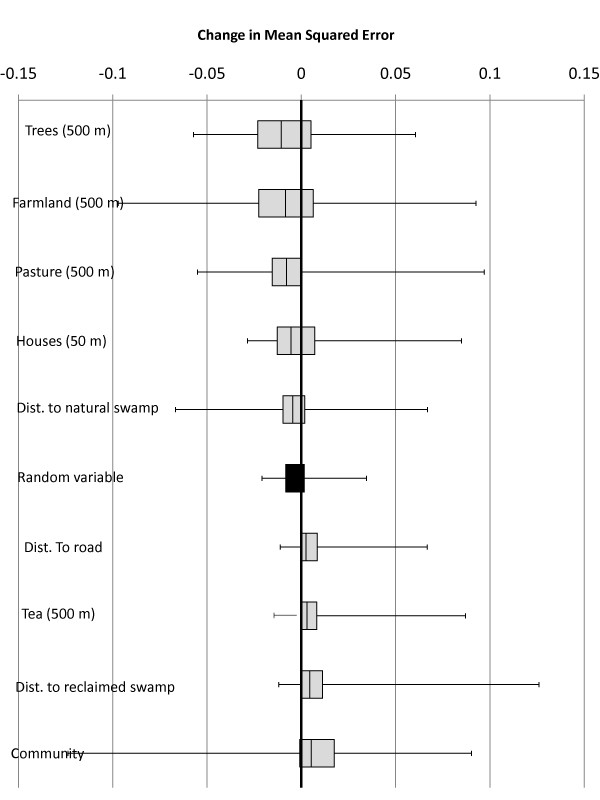
Results: Variables related to topographic wetness proved most useful in predicting the households of individuals contracting malaria in this region of rugged terrain. Other variables related to human modification of the environment also demonstrated clear associations with household malaria. However, these land-cover/land-use variables failed to produce unambiguous improvements in statistical predictive models controlling for important topographic factors, with none improving prediction of household-level malaria more than 75% of the time.
Conclusions: Topographic wetness values in this region of highly varied terrain more accurately predicted houses at greater risk of malaria than did consideration of land-cover/land-use characteristics. As such, those planning control or local elimination strategies in similar highland regions may use topographic and geographic characteristics to effectively identify high-receptivity regions that may require enhanced vigilance.
Figures
References
-
- WHO. Malaria elimination: a field manual for low and moderate endemic countries. Geneva: World Health Organization; 2007.
Publication types
MeSH terms
Substances
Grants and funding
LinkOut - more resources
Full Text Sources
Medical
Research Materials
