. 2010 Nov 17:11:638.
doi: 10.1186/1471-2164-11-638.

Integrated genomics of susceptibility to alkylator-induced leukemia in mice

Affiliations

Integrated genomics of susceptibility to alkylator-induced leukemia in mice

Patrick Cahan et al. BMC Genomics. .

Abstract

Background: Therapy-related acute myeloid leukemia (t-AML) is a secondary, generally incurable, malignancy attributable to chemotherapy exposure. Although there is a genetic component to t-AML susceptibility in mice, the relevant loci and the mechanism(s) by which they contribute to t-AML are largely unknown. An improved understanding of susceptibility factors and the biological processes in which they act may lead to the development of t-AML prevention strategies.

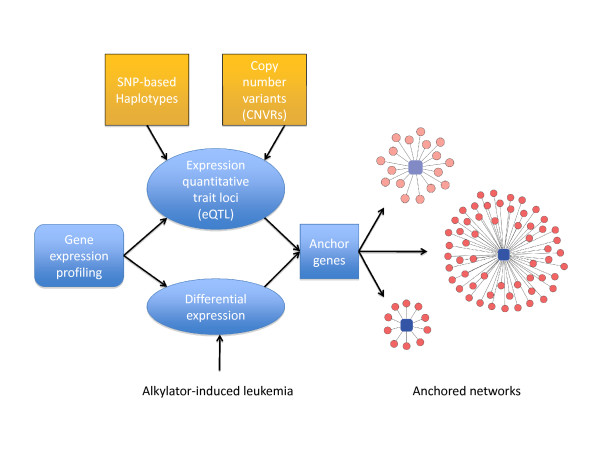
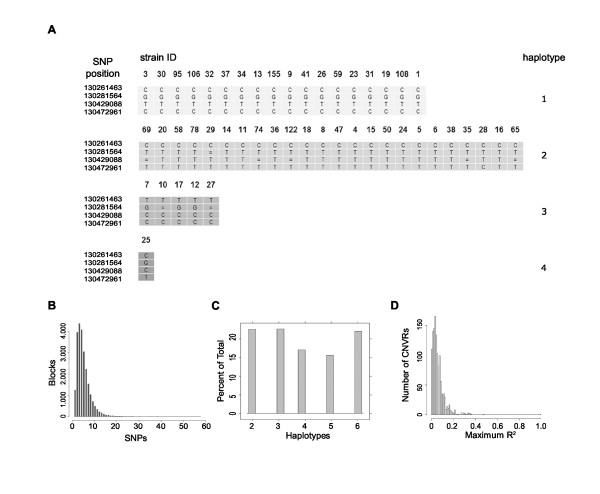
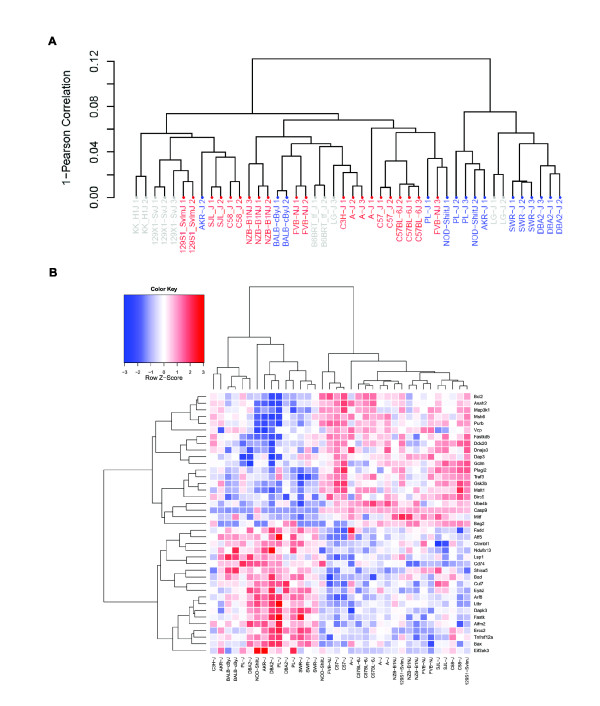
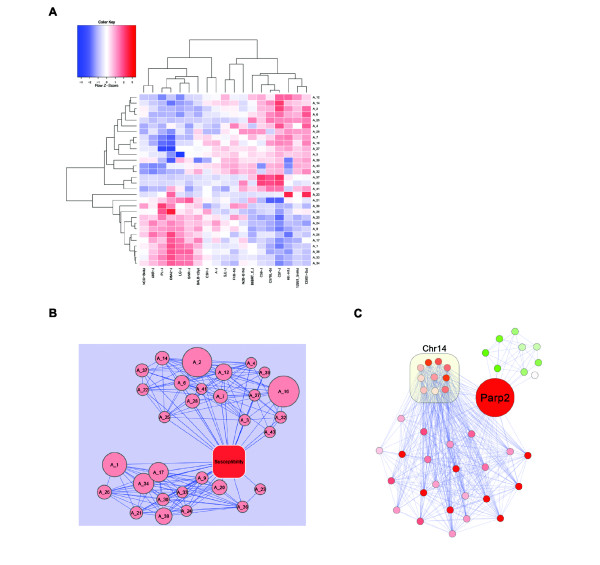
Results: In this work we applied an integrated genomics strategy in inbred strains of mice to find novel factors that might contribute to susceptibility. We found that the pre-exposure transcriptional state of hematopoietic stem/progenitor cells predicts susceptibility status. More than 900 genes were differentially expressed between susceptible and resistant strains and were highly enriched in the apoptotic program, but it remained unclear which genes, if any, contribute directly to t-AML susceptibility. To address this issue, we integrated gene expression data with genetic information, including single nucleotide polymorphisms (SNPs) and DNA copy number variants (CNVs), to identify genetic networks underlying t-AML susceptibility. The 30 t-AML susceptibility networks we found are robust: they were validated in independent, previously published expression data, and different analytical methods converge on them. Further, the networks are enriched in genes involved in cell cycle and DNA repair (pathways not discovered in traditional differential expression analysis), suggesting that these processes contribute to t-AML susceptibility. Within these networks, the putative regulators (e.g., Parp2, Casp9, Polr1b) are the most likely to have a non-redundant role in the pathogenesis of t-AML. While identifying these networks, we found that current CNVR and SNP-based haplotype maps in mice represented distinct sources of genetic variation contributing to expression variation, implying that mapping studies utilizing either source alone will have reduced sensitivity.

Conclusion: The identification and prioritization of genes and networks not previously implicated in t-AML generates novel hypotheses on the biology and treatment of this disease that will be the focus of future research.


Figures

Figure 1
Figure 1
Data analysis pipeline to identify networks of genes associated with t-AML susceptibility and their putative upstream regulators. Gene expression profiling was performed on hematopoietic stem/progenitor cells from inbred strains of mice for which t-AML susceptibility has previously been assessed. Expression quantitative trait loci were identified by testing for association between SNP-derived haplotypes or CNVR genotypes (in cis) and expression. Genes differentially expressed between t-AML susceptible and resistant strains were identified. Differentially expressed genes that were also associated with eQTL are referred to as anchors and seeded expression network searches.
Figure 2
Figure 2
Mouse Haplotype Map. (A) Typical haplotype block (Block ID 13605, Additional File 1) derived from SNP data http://www.broadinstitute.org/mouse/hapmap/. Rows represent SNPs at the indicated positions on chromosome 4, '=' are untyped. Columns represent 48 classical inbred strains. Mouse Phenome Database strain identifiers are shown for each column. Strain haplotypes are shown on the right. Given the strain haplotypes, it is possible to predict all typed genotypes with at most a single error. The distribution of the number of SNPs (B) and haplotypes (C) per block. (D) SNP-derived haplotype blocks do not tag CNVRs within 250 kb.
Figure 3
Figure 3
Gene Expression Profiling of Hematopoietic Stem and Progenitor Cells in t-AML Resistant and Susceptible Strains of Mice. (A) Unsupervised clustering of expression probes that are present in at least 3 strains largely separates t-AML susceptible (blue) from resistant (red) strains. Susceptibility status of some strains is undetermined (grey). (B) Differentially expressed genes are enriched in apoptosis-related genes. A heatmap of apoptosis genes differentially expressed between t-AML susceptible and resistant strains is shown.
Figure 4
Figure 4
Anchored Susceptibility Networks. (A) Heatmap of anchored module eigengenes. For clarity, eigengene values were averaged by strain, and each module was row-normalized. Module Eigengenes are either positively (bottom half) or negatively (top half) correlated with susceptibility status. (B) Network view of anchored modules. Anchored modules are represented as nodes. Edges between modules represent network eigenegene correlation. Low and negative correlations are not shown for clarity. Edges between the 'Susceptibility' and anchored network nodes represent association between network eigengenes and susceptibility status. Node size indicates the number of response genes in the anchored network. The top super-module corresponds to the top half of the module heatmap displayed in panel A. Likewise, the bottom super-module corresponds to the bottom half of the module heatmap. (C) Module A_37, includes 10 genes on chromosome 14 located within 7 Mb of a CNVR. Green nodes represent genes with lower expression in susceptible strains, red nodes represent genes with higher expression in susceptible strains. Correlations among response genes, represented as edges, are only displayed for those relationships where the Pearson correlation > 0.5.

Similar articles

Cited by

References

    1. Leone G, Voso MT, Sica S, Morosetti R, Pagano L. Therapy related leukemias: susceptibility, prevention and treatment. Leuk Lymphoma. 2001;41(3-4):255–276. doi: 10.3109/10428190109057981. - DOI - PubMed
    1. Leone G, Pagano L, Ben-Yehuda D, Voso MT. Therapy-related leukemia and myelodysplasia: susceptibility and incidence. Haematologica. 2007;92(10):1389–1398. doi: 10.3324/haematol.11034. - DOI - PubMed
    1. Larson RA, Le Beau MM. Therapy-related myeloid leukaemia: a model for leukemogenesis in humans. Chem Biol Interact. 2005;153-154:187–195. doi: 10.1016/j.cbi.2005.03.023. - DOI - PubMed
    1. Knoche E, Mc Leod HL, Graubert TA. Pharmacogenetics of alkylator-associated acute myeloid leukemia. Pharmacogenomics. 2006;7(5):719–729. doi: 10.2217/14622416.7.5.719. - DOI - PubMed
    1. Side L, Taylor B, Cayouette M, Conner E, Thompson P, Luce M, Shannon K. Homozygous inactivation of the NF1 gene in bone marrow cells from children with neurofibromatosis type 1 and malignant myeloid disorders. N Engl J Med. 1997;336(24):1713–1720. doi: 10.1056/NEJM199706123362404. - DOI - PubMed

Publication types

MeSH terms

Substances