

Spatial dynamics of multistage cell lineages in tissue stratification
- PMID: 21081061
- PMCID: PMC2980753
- DOI: 10.1016/j.bpj.2010.09.034
Spatial dynamics of multistage cell lineages in tissue stratification
Abstract
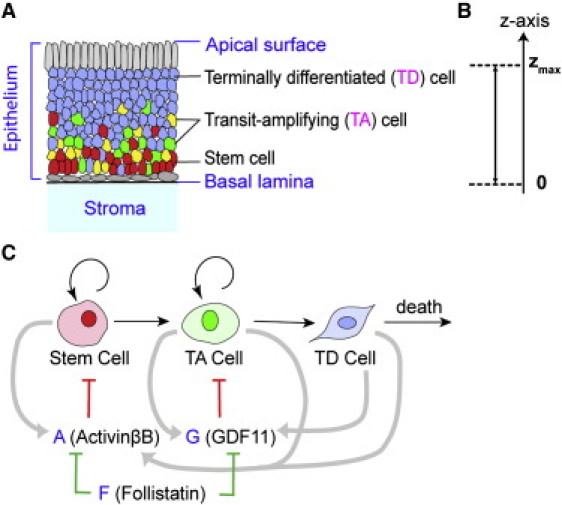
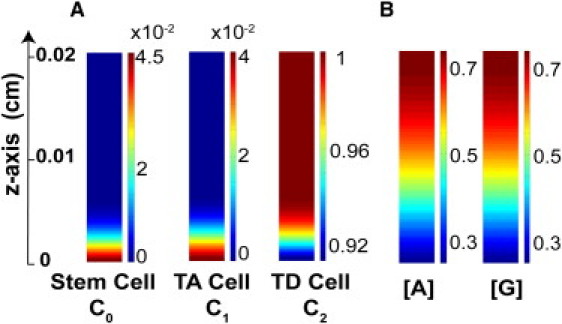
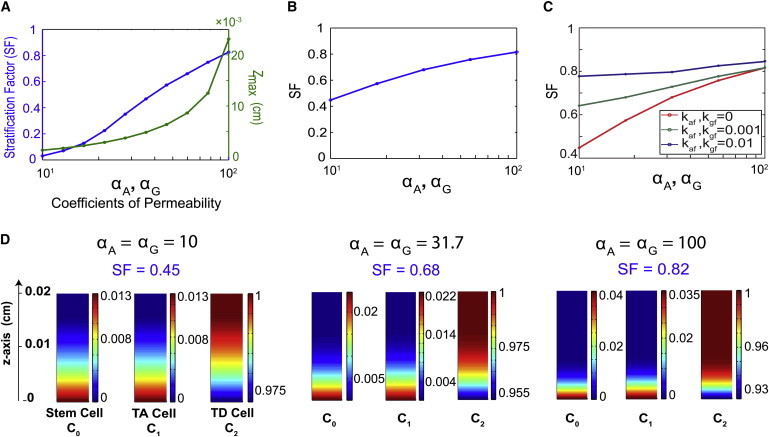
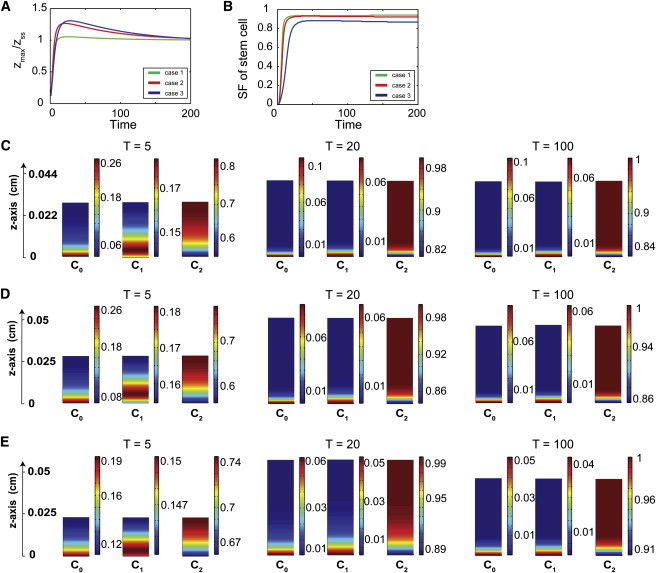
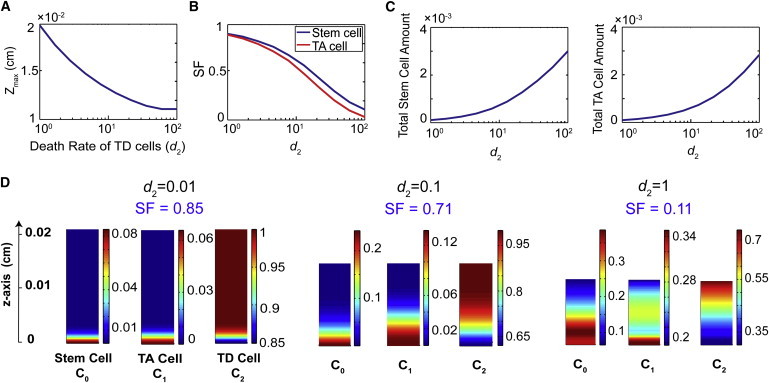
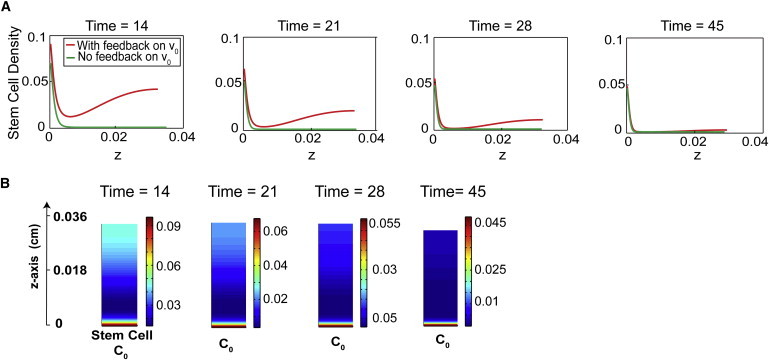
In developing and self-renewing tissues, terminally differentiated (TD) cell types are typically specified through the actions of multistage cell lineages. Such lineages commonly include a stem cell and multiple progenitor (transit-amplifying) cell stages, which ultimately give rise to TD cells. As the tissue reaches a tightly controlled steady-state size, cells at different lineage stages assume distinct spatial locations within the tissue. Although tissue stratification appears to be genetically specified, the underlying mechanisms that direct tissue lamination are not yet completely understood. Herein, we use modeling and simulations to explore several potential mechanisms that can be utilized to create stratification during developmental or regenerative growth in general systems and in the model system, the olfactory epithelium of mouse. Our results show that tissue stratification can be generated and maintained through controlling spatial distribution of diffusive signaling molecules that regulate the proliferation of each cell type within the lineage. The ability of feedback molecules to stratify a tissue is dependent on a low TD death rate: high death rates decrease tissue lamination. Regulation of the cell cycle lengths of stem cells by feedback signals can lead to transient accumulation of stem cells near the base and apex of tissue.
Copyright © 2010 Biophysical Society. Published by Elsevier Inc. All rights reserved.
Figures
Similar articles
-
Feedback regulation in multistage cell lineages.Math Biosci Eng. 2009 Jan;6(1):59-82. doi: 10.3934/mbe.2009.6.59. Math Biosci Eng. 2009. PMID: 19292508 Free PMC article.
-
Cell lineages and the logic of proliferative control.PLoS Biol. 2009 Jan 20;7(1):e15. doi: 10.1371/journal.pbio.1000015. PLoS Biol. 2009. PMID: 19166268 Free PMC article.
-
Spatial dynamics of feedback and feedforward regulation in cell lineages.PLoS Comput Biol. 2022 May 6;18(5):e1010039. doi: 10.1371/journal.pcbi.1010039. eCollection 2022 May. PLoS Comput Biol. 2022. PMID: 35522694 Free PMC article.
-
Epidermal Stem Cells.Adv Exp Med Biol. 2019;1201:239-259. doi: 10.1007/978-3-030-31206-0_12. Adv Exp Med Biol. 2019. PMID: 31898790 Review.
-
Identification and molecular regulation of neural stem cells in the olfactory epithelium.Exp Cell Res. 2005 Jun 10;306(2):309-16. doi: 10.1016/j.yexcr.2005.03.027. Epub 2005 Apr 21. Exp Cell Res. 2005. PMID: 15925585 Review.
Cited by
-
Multiple morphogens and rapid elongation promote segmental patterning during development.PLoS Comput Biol. 2021 Jun 23;17(6):e1009077. doi: 10.1371/journal.pcbi.1009077. eCollection 2021 Jun. PLoS Comput Biol. 2021. PMID: 34161317 Free PMC article.
-
A multiscale chemical-mechanical model predicts impact of morphogen spreading on tissue growth.NPJ Syst Biol Appl. 2023 May 20;9(1):16. doi: 10.1038/s41540-023-00278-5. NPJ Syst Biol Appl. 2023. PMID: 37210381 Free PMC article.
-
Stem cell niche structure as an inherent cause of undulating epithelial morphologies.Biophys J. 2013 Jan 8;104(1):237-46. doi: 10.1016/j.bpj.2012.11.3807. Epub 2013 Jan 8. Biophys J. 2013. PMID: 23332076 Free PMC article.
-
Interactions and tradeoffs between cell recruitment, proliferation, and differentiation affect CNS regeneration.Biophys J. 2014 Apr 1;106(7):1528-36. doi: 10.1016/j.bpj.2014.02.010. Biophys J. 2014. PMID: 24703314 Free PMC article.
-
Principles of regulation of self-renewing cell lineages.PLoS One. 2013 Sep 3;8(9):e72847. doi: 10.1371/journal.pone.0072847. eCollection 2013. PLoS One. 2013. PMID: 24019882 Free PMC article.
References
-
- Strain A.J. Transforming growth factor-β: the elusive hepatic chalone? Hepatology. 1992;16:269–270. - PubMed
-
- McPherron A.C., Lawler A.M., Lee S.J. Regulation of skeletal muscle mass in mice by a new TGF-beta superfamily member. Nature. 1997;387:83–90. - PubMed
-
- Wu H.H., Ivkovic S., Calof A.L. Autoregulation of neurogenesis by GDF11. Neuron. 2003;37:197–207. - PubMed
-
- Seuntjens E., Nityanandam A., Tarabykin V. Sip1 regulates sequential fate decisions by feedback signaling from postmitotic neurons to progenitors. Nat. Neurosci. 2009;12:1373–1380. - PubMed
Publication types
MeSH terms
Grants and funding
LinkOut - more resources
Full Text Sources
Medical
Research Materials
Miscellaneous
