. 2010 Nov 17;99(10):3345-54.
doi: 10.1016/j.bpj.2010.09.042.

A stochastic model for chemotaxis based on the ordered extension of pseudopods

Affiliations

A stochastic model for chemotaxis based on the ordered extension of pseudopods

Peter J M Van Haastert. Biophys J. .

Abstract

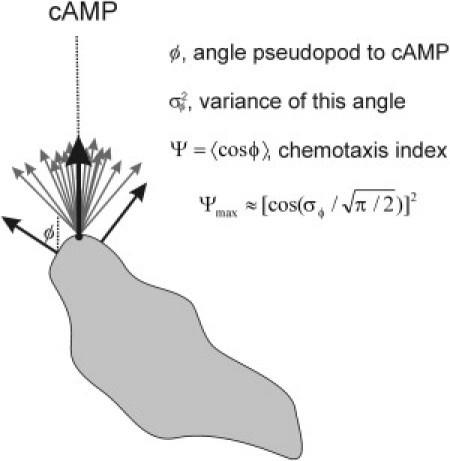
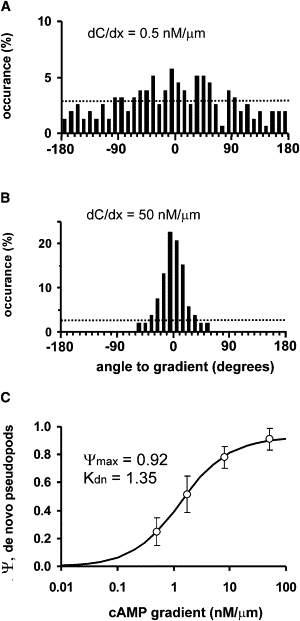
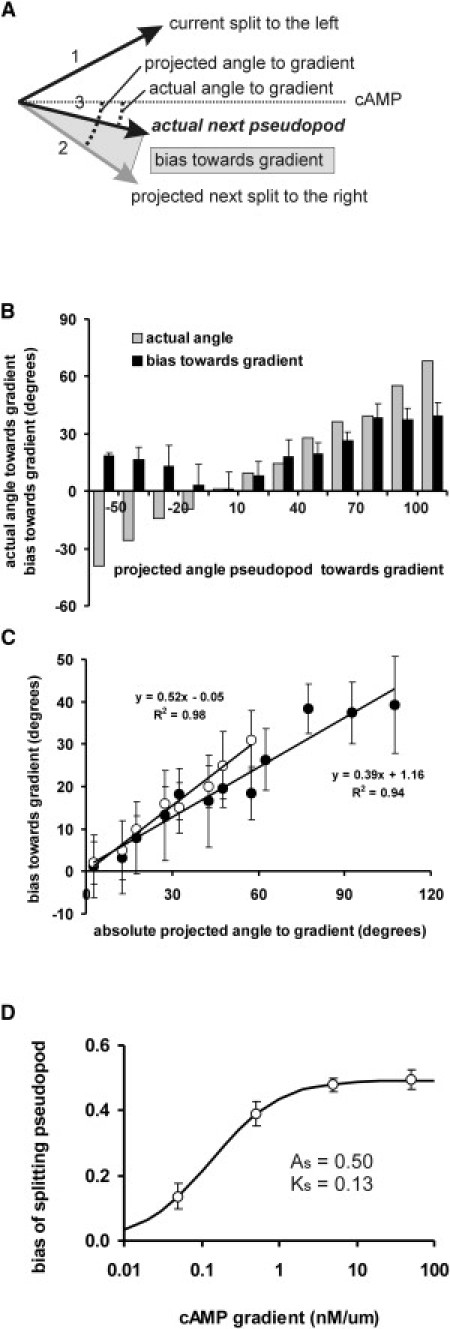
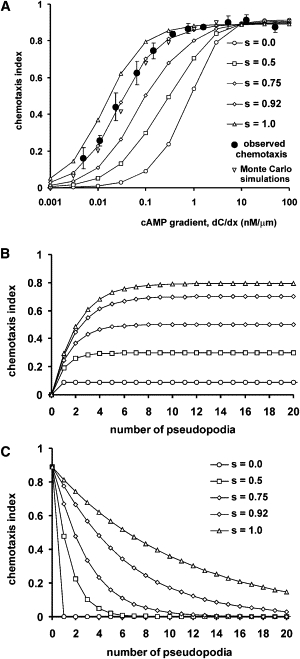
Many amoeboid cells move by extending pseudopods. Here I present a new stochastic model for chemotaxis that is based on pseudopod extensions by Dictyostelium cells. In the absence of external cues, pseudopod extension is highly ordered with two types of pseudopods: de novo formation of a pseudopod at the cell body in random directions, and alternating right/left splitting of an existing pseudopod that leads to a persistent zig-zag trajectory. We measured the directional probabilities of the extension of splitting and de novo pseudopods in chemoattractant gradients with different steepness. Very shallow cAMP gradients can bias the direction of splitting pseudopods, but the bias is not perfect. Orientation of de novo pseudopods require much steeper cAMP gradients and can be more precise. These measured probabilities of pseudopod directions were used to obtain an analytical model for chemotaxis of cell populations. Measured chemotaxis of wild-type cells and mutants with specific defects in these stochastic pseudopod properties are similar to predictions of the model. These results show that combining splitting and de novo pseudopods is a very effective way for cells to obtain very high sensitivity to stable gradient and still be responsive to changes in the direction of the gradient.


Figures

Figure 1
Figure 1
Pseudopod extension and optimal chemotaxis. Pseudopods (see arrows) are extended perpendicular to the cell surface. Therefore, pseudopods at the point of the cell closest to the cAMP source have the highest probability to be extended in the direction of the cAMP gradient. Because the surface curvature at this point is not always exactly perpendicular to the gradient, and because not all pseudopods are extended exactly perpendicular to the surface, some variance of pseudopod direction will be present, σϕ2. This variance reduces the maximal chemotaxis response. With the observed σϕ ∼ 20°, the maximal chemotaxis index is ∼0.9.
Figure 2
Figure 2
Stochastic model for chemotaxis. The current nth pseudopod is extended at an angle ϕn relative to the gradient. The extension of the next pseudopod is conceptually divided in three steps. In the first step, a splitting pseudopod is extended in the same direction as the current pseudopod, while a de novo pseudopod is extended in a random direction. In the second step, the splitting or de novo pseudopod gets a bias of direction due to the cAMP gradient; the bias is different for splitting and de novo pseudopods (see Figs. 3 and 4, and Eq. 4). In the third step, extending pseudopods have a variance of direction. Chemotaxis of a cell population is given by the combined effect of these three steps, as described in Eq. 5.
Figure 3
Figure 3
Determination of directional bias of de novo pseudopods. Cells were exposed to a cAMP gradient in a Zigmond chamber (A) or using a micropipette (B). The direction ϕ of the first pseudopod was measured. (A and B) Probability distribution of the angle ϕ of de novo pseudopods relative to the position gradient. The dashed line represents the expected random distribution of angles. (C) Chemotaxis index defined as Ψ = 〈cos ϕ〉, measured in different cAMP gradients. (Data points) Means and 95% confidence limits of ∼150 de novo pseudopods for each cAMP gradient. (Line) Fitted dose-response Eq. 4 with Kdn = 1.35 ± 0.34 nM/μm and maximal chemotaxis ΨmaxAdn = 0.925 ± 0.026. In Fig. 1 it was shown that Ψmax = 0.92, indicating that the maximal bias of de novo pseudopods Adn is close to 1.0.
Figure 4
Figure 4
Determination of directional bias of splitting pseudopods. (A) Scheme of measurements. In buffer, splitting pseudopods have a strong tendency to be extended alternating right/left at an angle of 55°. The present pseudopod, 1, is a split to the left, at an angle of x° relative to the gradient. Therefore, the next projected pseudopod, 2, is expected to be extended at an angle of x + 55° relative to the gradient. We measured the angle of actual pseudopod, 3, relative to the gradient, and define the bias as the difference between projected and actual pseudopod. (B) Pseudopod data were binned for the projected angles to the gradient. Measured was the actual angle to the gradient (shaded bars) and the difference with projected angle is the bias (solid bars). (C) The figure shows the bias for a shallow gradient (0.5 nM/μm, solid symbols) and steep gradient (50 nM/μm, open symbols). Linear regression analysis reveals that the intercepts with the y axis are close to zero, which means that the bias is zero if the projected angle is in the direction of the gradient. The slopes are smaller than 1, indicating that the gradient cannot fully bias splitting pseudopods in the direction of the gradient. (D) The bias was measured for different cAMP gradients. (Data points) Means and 95% confidence levels for ∼200 splitting pseudopods for each cAMP gradient. (Line) Fitted dose-response Eq. 4 with Ks = 0.13 ± 0.02 nM/μm and maximal bias As = 0.494 ± 0.007.
Figure 5
Figure 5
Kinetics and dose-dependency of chemotaxis. (A) The chemotaxis index was calculated with Eq. 5 for cells with different fractions of splitting pseudopods. (Solid symbols) Experimentally observed chemotaxis index for cells (which have s = 0.92 ± 0.02). (Triangle) Chemotaxis index obtained by Monte Carlo simulations (see Fig. S1). (B) Predicted chemotaxis index of cells that are exposed to a new gradient. (C) Predicted chemotaxis index of cells after removal of the gradient.
Figure 6
Figure 6
Expected and observed chemotaxis of signaling mutants. Pseudopod properties and chemotaxis was measured in wild-type AX3, mutant sgc/pla2-null with normal bias but reduced pseudopod splitting, mutant pkbA/pkbR1-null with reduced bias but normal pseudopod splitting, and mutant sgc/pla2/pkbR1 in the presence of 60 μM LY294002 with defects in both splitting and bias. The pseudopod properties of the mutants are presented in Table 1. The data points represent the chemotaxis index measured in different cAMP gradients; the lines are not fitted curves, but, instead, are the result of Eq. 5 using the measured pseudopod parameters.

Similar articles

Cited by

References

    1. Pollard T.D. The cytoskeleton, cellular motility and the reductionist agenda. Nature. 2003;422:741–745. - PubMed
    1. Van Haastert P.J.M., Bosgraaf L. Food searching strategy of amoeboid cells by starvation induced run length extension. PLoS ONE. 2009;4:e6814. - PMC - PubMed
    1. Ueda M., Ogihara S. Microtubules are required in amoeba chemotaxis for preferential stabilization of appropriate pseudopods. J. Cell Sci. 1994;107:2071–2079. - PubMed
    1. Takesono A., Heasman S.J., Ridley A.J. Microtubules regulate migratory polarity through Rho/ROCK signaling in T cells. PLoS ONE. 2010;5:e8774. - PMC - PubMed
    1. Swaney K.F., Huang C.H., Devreotes P.N. Eukaryotic chemotaxis: a network of signaling pathways controls motility, directional sensing, and polarity. Annu. Rev. Biophys. 2010;278:20445–20448. - PMC - PubMed