

Nonlinear optical imaging and Raman microspectrometry of the cell nucleus throughout the cell cycle
- PMID: 21081098
- PMCID: PMC2980749
- DOI: 10.1016/j.bpj.2010.06.069
Nonlinear optical imaging and Raman microspectrometry of the cell nucleus throughout the cell cycle
Abstract
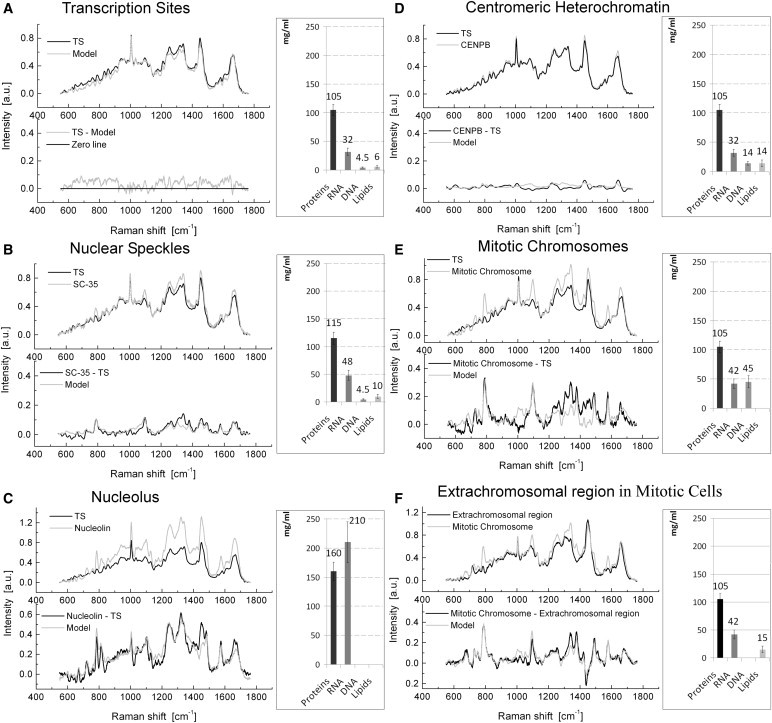
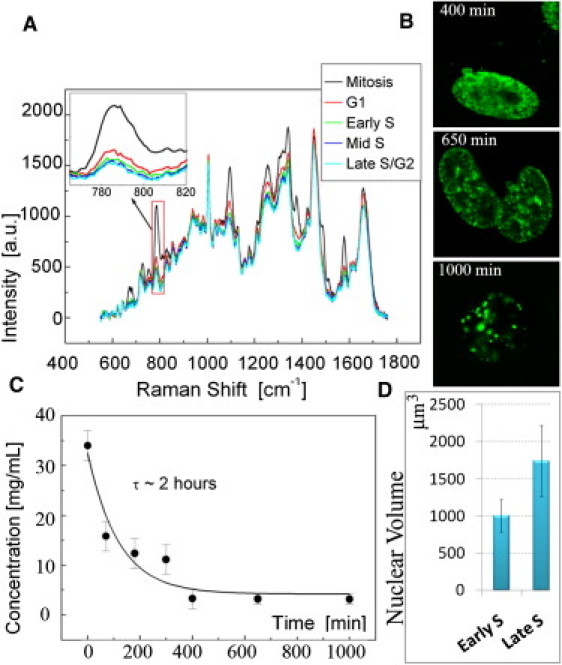
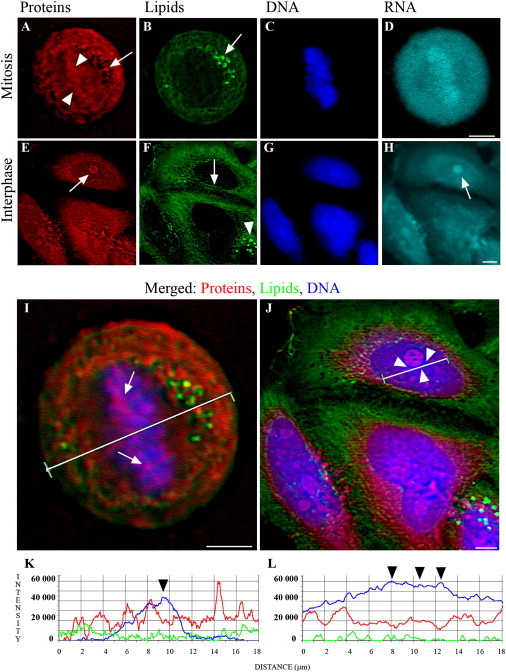
Fundamental understanding of cellular processes at molecular level is of considerable importance in cell biology as well as in biomedical disciplines for early diagnosis of infection and cancer diseases, and for developing new molecular medicine-based therapies. Modern biophotonics offers exclusive capabilities to obtain information on molecular composition, organization, and dynamics in a cell by utilizing a combination of optical spectroscopy and optical imaging. We introduce here a combination of Raman microspectrometry, together with coherent anti-Stokes Raman scattering (CARS) and two-photon excited fluorescence (TPEF) nonlinear optical microscopy, to study macromolecular organization of the nucleus throughout the cell cycle. Site-specific concentrations of proteins, DNA, RNA, and lipids were determined in nucleoli, nucleoplasmic transcription sites, nuclear speckles, constitutive heterochromatin domains, mitotic chromosomes, and extrachromosomal regions of mitotic cells by quantitative confocal Raman microspectrometry. A surprising finding, obtained in our study, is that the local concentration of proteins does not increase during DNA compaction. We also demonstrate that postmitotic DNA decondensation is a gradual process, continuing for several hours. The quantitative Raman spectroscopic analysis was corroborated with CARS/TPEF multimodal imaging to visualize the distribution of protein, DNA, RNA, and lipid macromolecules throughout the cell cycle.
Copyright © 2010 Biophysical Society. Published by Elsevier Inc. All rights reserved.
Figures
Similar articles
-
Raman and coherent anti-Stokes Raman scattering microspectroscopy for biomedical applications.J Biomed Opt. 2012 Apr;17(4):040801. doi: 10.1117/1.JBO.17.4.040801. J Biomed Opt. 2012. PMID: 22559673
-
Automated seeding-based nuclei segmentation in nonlinear optical microscopy.Appl Opt. 2013 Oct 1;52(28):6979-94. doi: 10.1364/AO.52.006979. Appl Opt. 2013. PMID: 24085213
-
Biophotonic probing of macromolecular transformations during apoptosis.Proc Natl Acad Sci U S A. 2010 Jul 20;107(29):12771-6. doi: 10.1073/pnas.1006374107. Epub 2010 Jul 6. Proc Natl Acad Sci U S A. 2010. PMID: 20615987 Free PMC article.
-
Correlation of histology and linear and nonlinear microscopy of the living human cornea.J Biophotonics. 2009 Mar;2(3):127-39. doi: 10.1002/jbio.200810039. J Biophotonics. 2009. PMID: 19343693 Review.
-
Coherent anti-stokes Raman scattering microscopy for high speed non- staining biomolecular imaging.Curr Pharm Biotechnol. 2013;14(2):150-8. Curr Pharm Biotechnol. 2013. PMID: 22356111 Review.
Cited by
-
Laser-emission imaging of nuclear biomarkers for high-contrast cancer screening and immunodiagnosis.Nat Biomed Eng. 2017;1:724-735. doi: 10.1038/s41551-017-0128-3. Epub 2017 Sep 4. Nat Biomed Eng. 2017. PMID: 29204310 Free PMC article.
-
Spatially Resolved Quantification of Chromatin Condensation through Differential Local Rheology in Cell Nuclei Fluorescence Lifetime Imaging.PLoS One. 2016 Jan 14;11(1):e0146244. doi: 10.1371/journal.pone.0146244. eCollection 2016. PLoS One. 2016. PMID: 26765322 Free PMC article.
-
Resonance Raman Probes for Organelle-Specific Labeling in Live Cells.Sci Rep. 2016 Jun 24;6:28483. doi: 10.1038/srep28483. Sci Rep. 2016. PMID: 27339882 Free PMC article.
-
Advances in measuring cancer cell metabolism with subcellular resolution.Nat Methods. 2022 Sep;19(9):1048-1063. doi: 10.1038/s41592-022-01572-6. Epub 2022 Aug 25. Nat Methods. 2022. PMID: 36008629 Review.
-
Nanotechnology for photodynamic therapy: a perspective from the Laboratory of Dr. Michael R. Hamblin in the Wellman Center for Photomedicine at Massachusetts General Hospital and Harvard Medical School.Nanotechnol Rev. 2015 Aug;4(4):359-372. doi: 10.1515/ntrev-2015-0027. Epub 2015 Aug 7. Nanotechnol Rev. 2015. PMID: 26640747 Free PMC article.
References
-
- Raska I. Oldies but goldies: searching for Christmas trees within the nucleolar architecture. Trends Cell Biol. 2003;13:517–525. - PubMed
-
- Lamond A.I., Spector D.L. Nuclear speckles: a model for nuclear organelles. Nat. Rev. Mol. Cell Biol. 2003;4:605–612. - PubMed
-
- Grewal S.I., Jia S. Heterochromatin revisited. Nat. Rev. Genet. 2007;8:35–46. - PubMed
-
- Spector D.L. SnapShot: cellular bodies. Cell. 2006;127:1071. - PubMed
Publication types
MeSH terms
Substances
LinkOut - more resources
Full Text Sources
