

Distinct roles of Ape1 protein in the repair of DNA damage induced by ionizing radiation or bleomycin
- PMID: 21081487
- PMCID: PMC3037609
- DOI: 10.1074/jbc.M110.146498
Distinct roles of Ape1 protein in the repair of DNA damage induced by ionizing radiation or bleomycin
Abstract
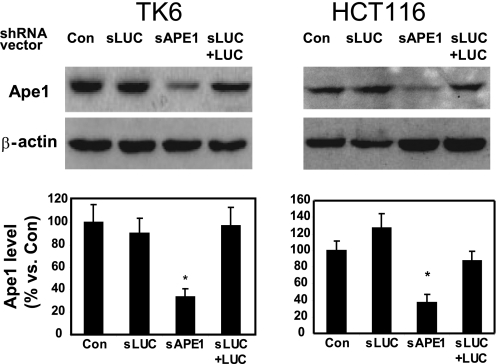
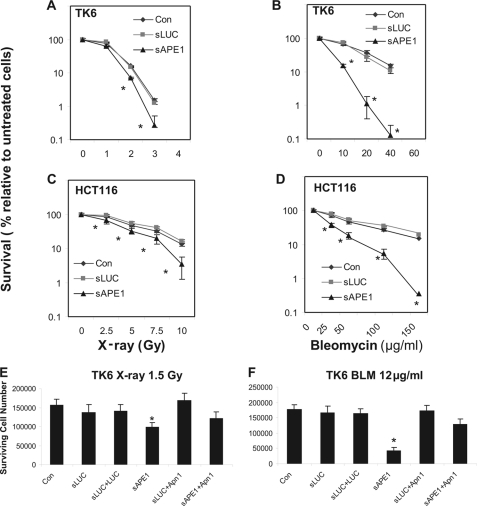
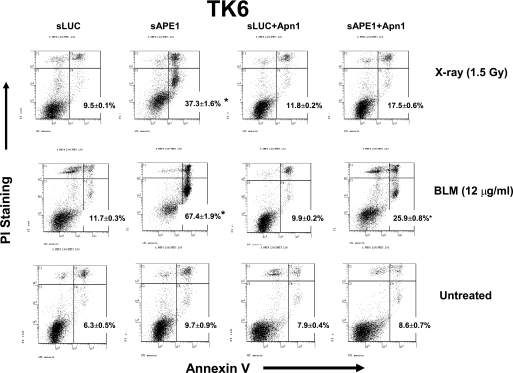
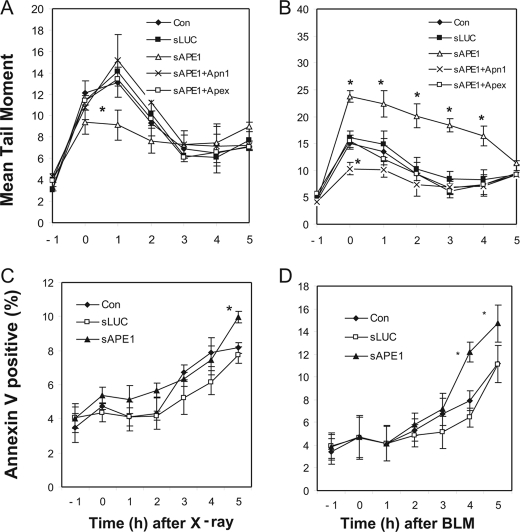
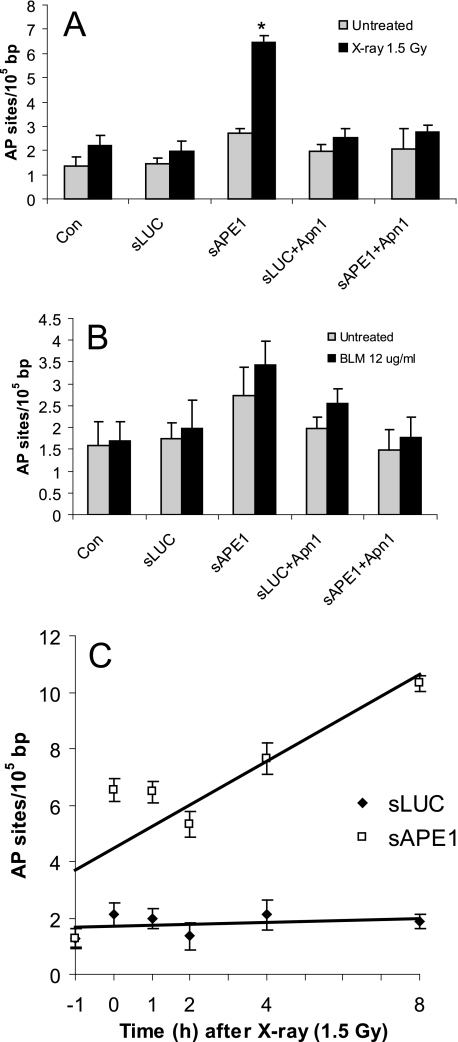
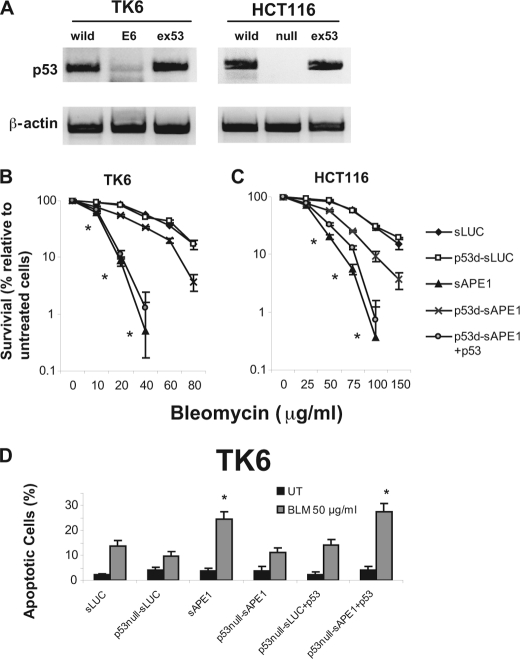
Ionizing radiation (IR) and bleomycin (BLM) are used to treat various types of cancers. Both agents generate cytotoxic double strand breaks (DSB) and abasic (apurinic/apyrimidinic (AP)) sites in DNA. The human AP endonuclease Ape1 acts on abasic or 3'-blocking DNA lesions such as those generated by IR or BLM. We examined the effect of siRNA-mediated Ape1 suppression on DNA repair and cellular resistance to IR or BLM in human B-lymphoblastoid TK6 cells and HCT116 colon tumor cells. Partial Ape1 deficiency (∼30% of normal levels) sensitized cells more dramatically to BLM than to IR cytotoxicity. In both cases, expression of the unrelated yeast AP endonuclease, Apn1, largely restored resistance. Ape1 deficiency increased DNA AP site accumulation due to IR treatment but reduced the number of DSB. In contrast, for BLM, there were more DSB under Ape1 deficiency, with little change in the accumulation of AP sites. Although the role of Ape1 in generating DSB was greater for IR, the enzyme facilitated removal of AP sites, which may mitigate the cytotoxic effects of IR. In contrast, BLM generates scattered AP sites, and the DSB have 3'-phosphoglycolate termini that require Ape1 processing. These DSB persist under Ape1 deficiency. Apoptosis induced by BLM (but not by IR) under Ape1 deficiency was partially p53-dependent, more dramatically in TK6 than HCT116 cells. Thus, Ape1 suppression or inhibition may be a more efficacious adjuvant for BLM than for IR cancer therapy, particularly for tumors with a functional p53 pathway.
Figures
Similar articles
-
Inhibition of the human apurinic/apyrimidinic endonuclease (APE1) repair activity and sensitization of breast cancer cells to DNA alkylating agents with lucanthone.Anticancer Res. 2004 Jul-Aug;24(4):2127-34. Anticancer Res. 2004. PMID: 15330152
-
Altered expression of Ape1/ref-1 in germ cell tumors and overexpression in NT2 cells confers resistance to bleomycin and radiation.Cancer Res. 2001 Mar 1;61(5):2220-5. Cancer Res. 2001. PMID: 11280790
-
Human glyceraldehyde-3-phosphate dehydrogenase plays a direct role in reactivating oxidized forms of the DNA repair enzyme APE1.J Biol Chem. 2008 Nov 7;283(45):30632-41. doi: 10.1074/jbc.M801401200. Epub 2008 Sep 5. J Biol Chem. 2008. PMID: 18776186 Free PMC article.
-
Human AP endonuclease 1 (APE1): from mechanistic insights to druggable target in cancer.Cancer Treat Rev. 2010 Aug;36(5):425-35. doi: 10.1016/j.ctrv.2009.12.006. Epub 2010 Jan 6. Cancer Treat Rev. 2010. PMID: 20056333 Review.
-
Functions of the major abasic endonuclease (APE1) in cell viability and genotoxin resistance.Mutagenesis. 2020 Feb 13;35(1):27-38. doi: 10.1093/mutage/gez046. Mutagenesis. 2020. PMID: 31816044 Free PMC article. Review.
Cited by
-
Removal of reactive oxygen species-induced 3'-blocked ends by XPF-ERCC1.Chem Res Toxicol. 2011 Nov 21;24(11):1876-81. doi: 10.1021/tx200221j. Epub 2011 Oct 18. Chem Res Toxicol. 2011. PMID: 22007867 Free PMC article.
-
High APEX1 Expression Facilitates Osteosarcoma Cell Proliferation.Asian Pac J Cancer Prev. 2025 Feb 1;26(2):453-463. doi: 10.31557/APJCP.2025.26.2.453. Asian Pac J Cancer Prev. 2025. PMID: 40022689 Free PMC article.
-
Non-muscle invasive bladder cancer tissues have increased base excision repair capacity.Sci Rep. 2020 Oct 1;10(1):16371. doi: 10.1038/s41598-020-73370-z. Sci Rep. 2020. PMID: 33004944 Free PMC article.
-
Apurinic/apyrimidinic endonuclease 1, the sensitive marker for DNA deterioration in dextran sulfate sodium-induced acute colitis.Redox Rep. 2013;18(5):165-73. doi: 10.1179/1351000213Y.0000000056. Epub 2013 Jul 23. Redox Rep. 2013. PMID: 23883737 Free PMC article.
-
Human DNA Telomeres in Presence of Oxidative Lesions: The Crucial Role of Electrostatic Interactions on the Stability of Guanine Quadruplexes.Antioxidants (Basel). 2019 Aug 22;8(9):337. doi: 10.3390/antiox8090337. Antioxidants (Basel). 2019. PMID: 31443537 Free PMC article.
References
-
- Von Sonntag C. (1987) The Chemical Basis of Radiation Biology, Taylor & Francis Ltd., London
-
- Milligan J. R., Aguilera J. A., Paglinawan R. A., Nguyen K. J., Ward J. F. (2002) Int. J. Radiat. Biol. 78, 733–741 - PubMed
-
- Yang N., Chaudhry M. A., Wallace S. S. (2006) DNA Repair 5, 43–51 - PubMed
-
- Sutherland B. M., Bennett P. V., Sutherland J. C., Laval J. (2002) Radiat. Res. 157, 611–616 - PubMed
-
- Chen J., Stubbe J. (2005) Nat. Rev. Cancer 5, 102–112 - PubMed
Publication types
MeSH terms
Substances
Grants and funding
LinkOut - more resources
Full Text Sources
Molecular Biology Databases
Research Materials
Miscellaneous
