. 2011 Jan 21;286(3):2047-56.
doi: 10.1074/jbc.M110.158790. Epub 2010 Nov 16.

miR-200b targets Ets-1 and is down-regulated by hypoxia to induce angiogenic response of endothelial cells

Affiliations

miR-200b targets Ets-1 and is down-regulated by hypoxia to induce angiogenic response of endothelial cells

Yuk Cheung Chan et al. J Biol Chem. .

Abstract

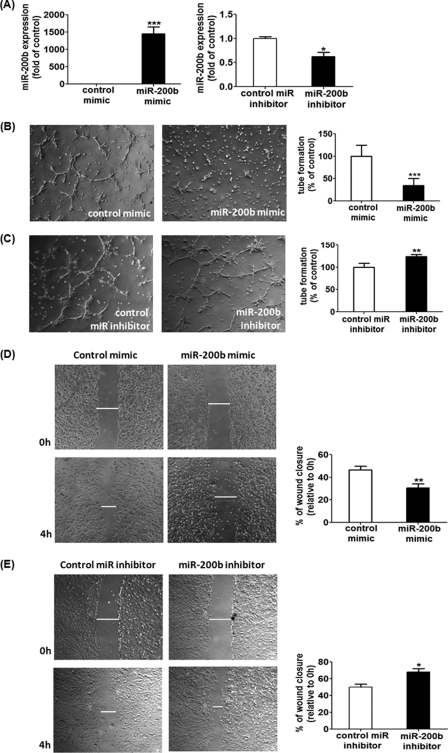
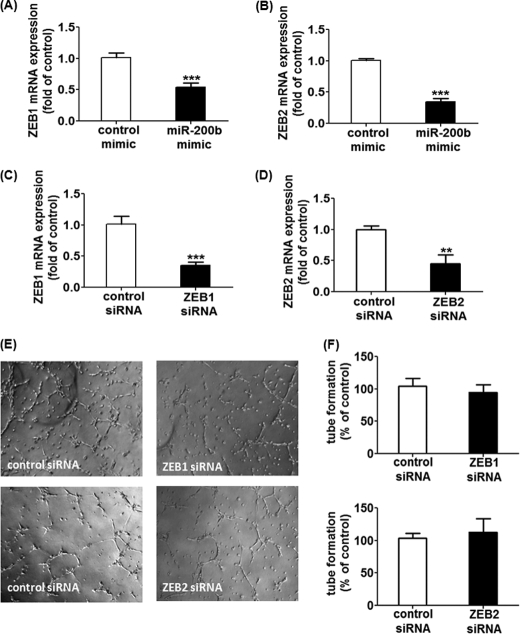
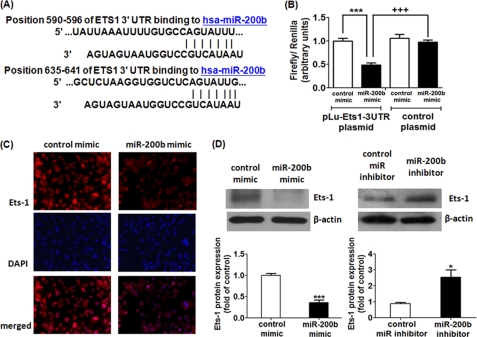
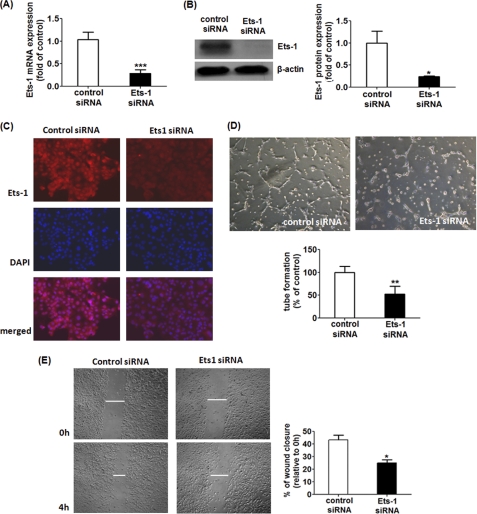
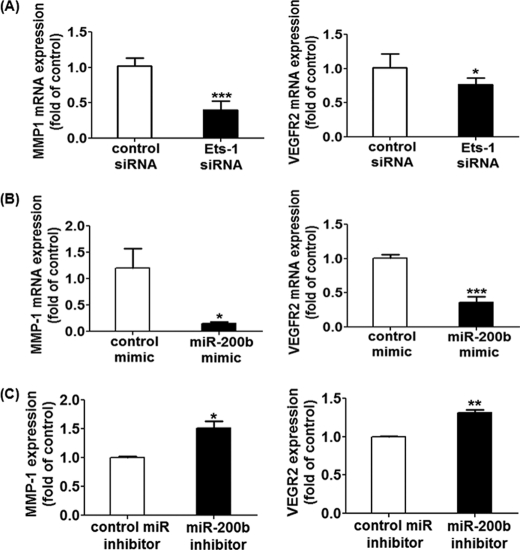
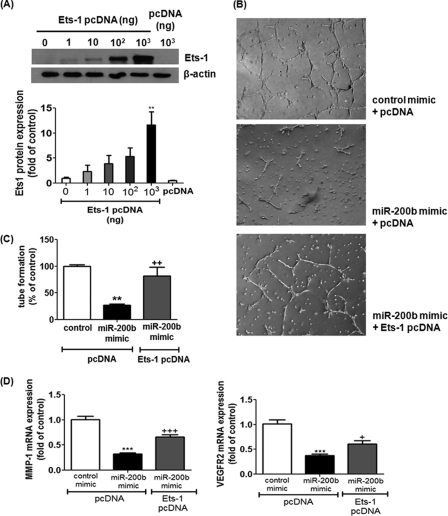
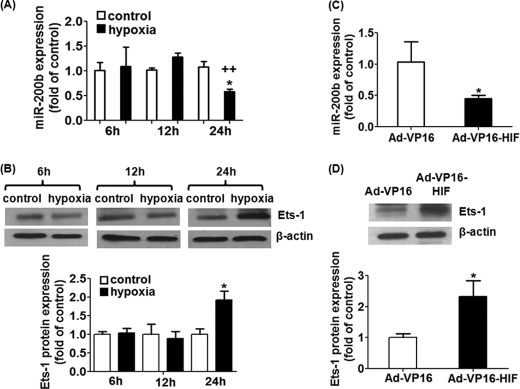
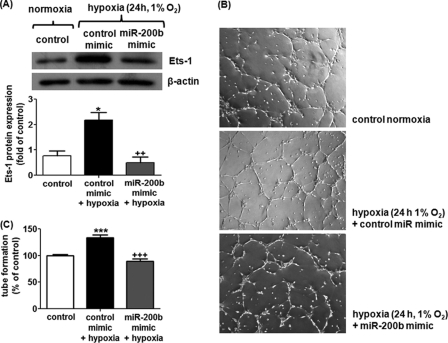
The miR-200 family plays a crucial role in epithelial to mesenchymal transition via controlling cell migration and polarity. We hypothesized that miR-200b, one miR-200 family member, could regulate angiogenic responses via modulating endothelial cell migration. Delivery of the miR-200b mimic in human microvascular endothelial cells (HMECs) suppressed the angiogenic response, whereas miR-200b-depleted HMECs exhibited elevated angiogenesis in vitro, as evidenced by Matrigel® tube formation and cell migration. Using in silico studies, miR target reporter assay, and Western blot analysis revealed that v-ets erythroblastosis virus E26 oncogene homolog 1 (Ets-1), a crucial angiogenesis-related transcription factor, serves as a novel direct target of miR-200b. Knocking down endogenous Ets-1 simulated an anti-angiogenic response of the miR-200b mimic-transfected cells. Certain Ets-1-associated genes, namely matrix metalloproteinase 1 and vascular endothelial growth factor receptor 2, were negatively regulated by miR-200b. Overexpression of Ets-1 rescued miR-200b-dependent impairment in angiogenic response and suppression of Ets-1-associated gene expression. Both hypoxia as well as HIF-1α stabilization inhibited miR-200b expression and elevated Ets-1 expression. Experiments to identify how miR-200b modulates angiogenesis under a low oxygen environment illustrated that hypoxia-induced miR-200b down-regulation de-repressed Ets-1 expression to promote angiogenesis. This study provides the first evidence that hypoxia-sensitive miR-200b is involved in induction of angiogenesis via directly targeting Ets-1 in HMECs.


Figures

FIGURE 1.
FIGURE 1.
miR-200b exhibited anti-angiogenic effects in HMECs. A, real time PCR analysis of miR-200b expression after transfection of miR-200b mimic (left) or miR-200b inhibitor (right). Results are mean ± S.E. *** indicates p < 0.001; * represents p < 0.05 compared with control. Matrigel tube formation visualized by phase-contrast microscopy at 8 h after miR-200b mimic delivery (B) or down-regulation (C). Representative image of at least 3 independent experiments. Quantification of the length of tube formation (% of control) of the miR-200b mimic or miR-200b inhibitor-transfected cells. Results are mean ± S.E. *** indicates p < 0.001; ** represents p < 0.01 compared with control. Representative images of the in vitro scratch wound closure assay were visualized by phase-contrast microscopy at 0 and 4 h post-wounding in miR-200b mimic-delivered (D) or miR-200b-depleted (E) HMECs. Cell migration was assessed by quantification of scratch wound closure (relative to 0 h). Results are mean ± S.E. ** indicates p < 0.01; * represents p < 0.05 compared with control.
FIGURE 2.
FIGURE 2.
ZEB1 or ZEB2 do not serve as the mediators in miR-200b-associated antiangiogenic response. Real time PCR analysis of ZEB1 and ZEB2 expression after transfection of miR-200b mimic (A and B), ZEB1 siRNA (C), or ZEB2 (D). Results are mean ± S.E. ** represents p < 0.01; *** indicates p < 0.001 compared with corresponding control. E, Matrigel tube formation visualized by phase-contrast microscopy at 8 h after transfection of either ZEB1 siRNA or ZEB2 siRNA. Representative image of at least 3 independent experiments are shown. F, quantification of the length of tube formation (% of control) of cells with ZEB1 or ZEB2 knockdown is shown. Results are mean ± S.E.
FIGURE 3.
FIGURE 3.
Ets-1 serves as a novel direct target of miR-200b. A, in silico study revealing two possible binding sites in Ets-1 3′ UTR for miR-200b as predicted by Targetscan, Pictar, MiRanda, MiRBase Target Data base, and miRDB. B, miR target reporter luciferase assay after the miR-200b mimic delivery in HEK-293 cells. Open and solid bars represent control mimic and miR-200b mimic-delivered cells, respectively. Results were normalized with data obtained from an assay with Renilla luciferase and expressed as mean ± S.E. *** indicates p < 0.001 compared with control mimic-transfected cells; +++ represents p < 0.001 compared with control plasmid-transfected cells. C, representative diagram showing Ets-1 immunoreactivity after miR-200b mimic delivery from three independent experiments. Nuclear counterstain with DAPI and the corresponding merged image are shown in the lower panels. D, Western blot analysis of Ets-1 protein expression in miR-200b mimic-delivered (left) and -depleted (right) HMECs. β-Actin serves a loading control. Representative blot from three independent experiments is shown. Quantification of the band intensity relative to control. Results are mean ± S.E. *** indicates p < 0.001; * represents p < 0.05 compared with control.
FIGURE 4.
FIGURE 4.
Down-regulation of Ets-1 simulated the effects of miR-200b mimic in angiogenic response and cell migration. A, real time PCR analysis of Ets-1 mRNA after transfection of Ets-1 siRNA. Results are mean ± S.E. *** indicates p < 0.001 compared with control siRNA. B, Western blot analysis of Ets-1 protein expression after transfection of Ets-1 siRNA; β-actin serves a loading control. Representative blot from three independent experiments. Quantification of band intensity relative to control. Results are mean ± S.E. * represent p < 0.05 compared with control siRNA. C, representative diagram showing Ets-1 immunoreactivity after knocking down Ets-1 from three independent experiments. Nuclear counterstain with DAPI and the corresponding merged image are shown in the lower panels. D, Matrigel tube formation visualized by phase-contrast microscopy at 8 h after Ets-1 down-regulation. Representative image of at least three independent experiments. Quantification of the length of tube formation (% of control) of Ets-1 siRNA-transfected cells. Results are mean ± S.E. ** indicates p < 0.01 compared with control. E, representative image of a in vitro scratch wound closure assay visualized by phase-contrast microscopy at 0 and 4 h post-wounding in Ets-1 knock-down cells. Cell migration of Ets-1-depleted cells was assessed by quantification of scratch wound closure (relative to 0 h). Results are mean ± S.E. * represent p < 0.05 compared with control.
FIGURE 5.
FIGURE 5.
Expression of Ets-1 related genes in Ets-1 knock-down, miR-200b mimic-delivered, and miR-200b-depleted HMECs. Real time PCR analysis of MMP-1 and VEGFR2 expression after transfection of Ets-1 siRNA (A), miR-200b mimic (B), or miR-200b inhibitor (C). Results are mean ± S.E. *** indicates p < 0.001. ** indicates p < 0.01; * represents p < 0.05 compared with corresponding control.
FIGURE 6.
FIGURE 6.
Ets-1 overexpression reversed miR-200b mimic-mediated anti-angiogenic effects and its associated down-regulation of MMP-1 and VEGFR2. A, Western blot analysis of Ets-1 protein expression after transient transfection of various amounts of expressing plasmid encoding Ets-1 (Ets-1 pcDNA) in HMECs; β-actin serves a loading control. Representative blot from three independent experiments is shown. Quantification of the band intensity relative to control. Results are mean ± S.E. ** represent p < 0.01 compared with control empty vector (pcDNA). B, Matrigel tube formation visualized by phase-contrast microscopy at 8 h after delivery of control or miR-200b mimic in the presence or absence of Ets-1 pcDNA. Representative image of at least three independent experiments is shown. Quantification of the length of tube formation (% of control). Results are mean ± S.E. ** indicates p < 0.01 compared with control mimic + pcDNA; ++ indicates p < 0.01 compared with miR-200b mimic + pcDNA. C, real time PCR analysis of MMP-1 and VEGFR2 expression after delivery of control or miR-200b mimic in the presence or absence of Ets-1 pcDNA. Results are mean ± S.E. *** indicates p < 0.001 compared with control mimic + pcDNA. +++ indicates p < 0.001; + represents p < 0.05 compared with miR-200b mimic + pcDNA.
FIGURE 7.
FIGURE 7.
Down-regulation of miR-200b and up-regulation of Ets-1 was observed upon hypoxia or HIF-1α stabilization by infection of adenovirus encoding oxygen-insensitive HIF-1α (Ad-VP16-HIF). A and C, real time PCR analysis of miR-200b expression in hypoxia (1% O2 for 24 h)-treated HMECs or HIF-stabilized HMECs. Results are mean ± S.E. * represent p < 0.05 compared with corresponding control; ++ indicates p < 0.01 compared with the 12-h hypoxia. B and D, Western blot analysis of Ets-1 protein expression in hypoxia (1% O2 for 24 h)-treated HMECs or HIF-stabilized HMECs; β-actin serves a loading control. Representative blot from three independent experiments. Quantification of the band intensity relative to control. Results are mean ± S.E. * represent p < 0.05 compare with corresponding control or control virus (Ad-VP16)-infected cells, respectively.
FIGURE 8.
FIGURE 8.
Hypoxia-induced Ets-1 up-regulation and angiogenesis were abrogated by miR-200b mimic delivery in HMEC. A, Western blot analysis of Ets-1 in HMECs treated with hypoxia (1% O2 for 24 h) with or without miR-200b mimic. β-Actin serves a loading control. Representative blot from three independent experiments is shown. Quantification of the band intensity relative to control. Results are mean ± S.E. * represents p < 0.05 compared with control; ++ indicates p < 0.01 compared with co-treatment of hypoxia and control mimic. B, Matrigel tube formation visualized by phase-contrast microscopy at 8 h after hypoxia pre-conditioning treatment for 24 h in the presence or absence of miR-200b mimic (B and C). Representative image of at least three independent experiments. Quantification of the length of tube formation (% of control) of hypoxia-preconditioned HMECs in the presence or absence of miR-200b mimic. Results are mean ± S.E. *** indicates p < 0.001; +++ indicates p < 0.001 compared with co-treatment of hypoxia and control mimic.

References

    1. Rajewsky N. (2006) Nat. Genet. 38, (suppl.) S8–13 - PubMed
    1. Kuehbacher A., Urbich C., Zeiher A. M., Dimmeler S. (2007) Circ. Res. 101, 59–68 - PubMed
    1. Shilo S., Roy S., Khanna S., Sen C. K. (2008) Arterioscler. Thromb. Vasc. Biol. 28, 471–477 - PubMed
    1. Suárez Y., Fernández-Hernando C., Pober J. S., Sessa W. C. (2007) Circ. Res. 100, 1164–1173 - PubMed
    1. Suárez Y., Fernández-Hernando C., Yu J., Gerber S. A., Harrison K. D., Pober J. S., Iruela-Arispe M. L., Merkenschlager M., Sessa W. C. (2008) Proc. Natl. Acad. Sci. U.S.A. 105, 14082–14087 - PMC - PubMed

Publication types

MeSH terms

LinkOut - more resources