. 2011 Jan 28;286(4):2918-32.
doi: 10.1074/jbc.M110.171975. Epub 2010 Nov 16.

ChChd3, an inner mitochondrial membrane protein, is essential for maintaining crista integrity and mitochondrial function

Affiliations

ChChd3, an inner mitochondrial membrane protein, is essential for maintaining crista integrity and mitochondrial function

Manjula Darshi et al. J Biol Chem. .

Abstract

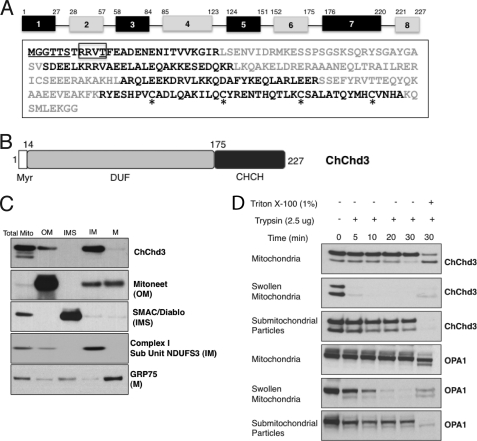
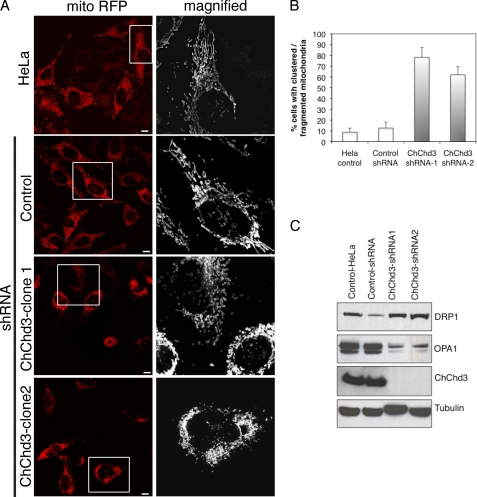
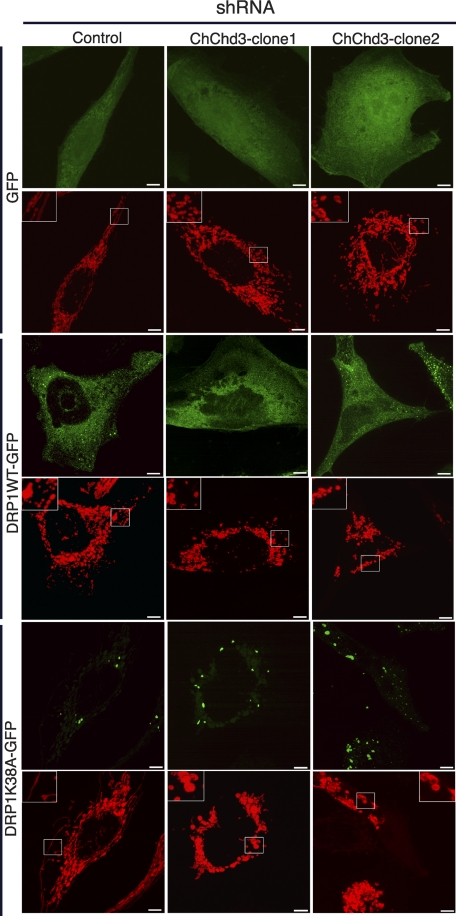
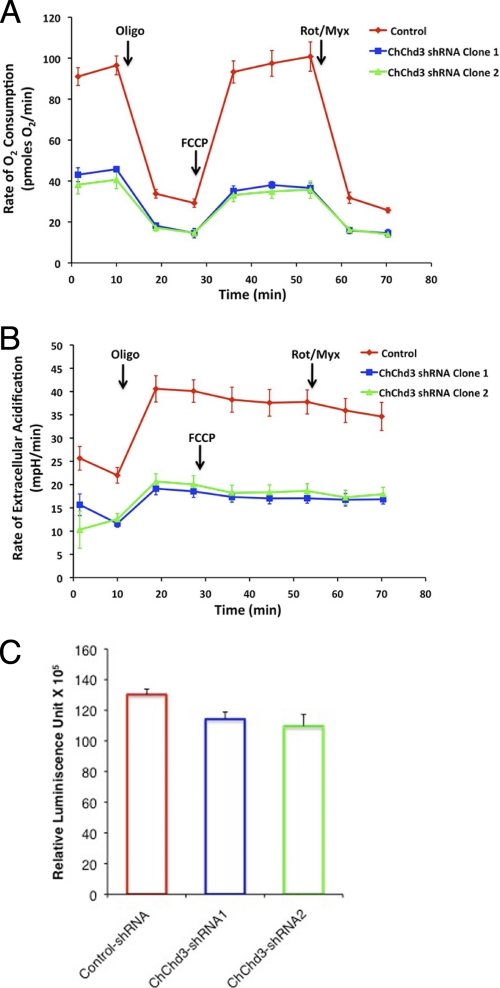
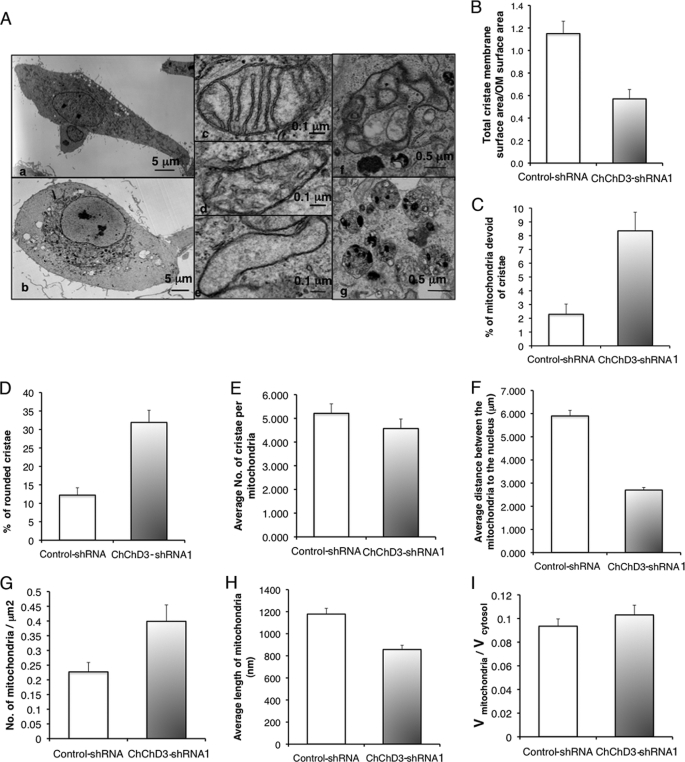
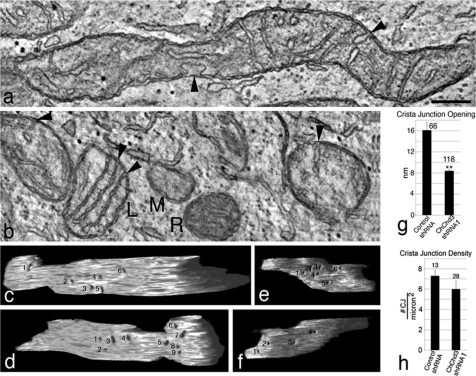
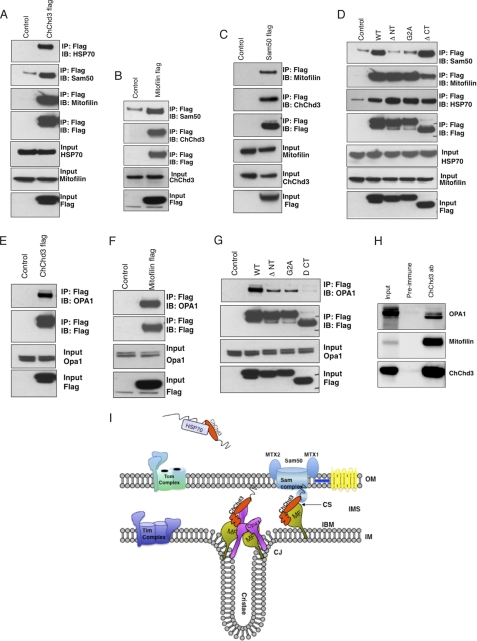
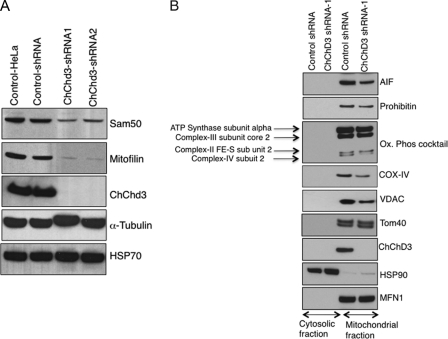
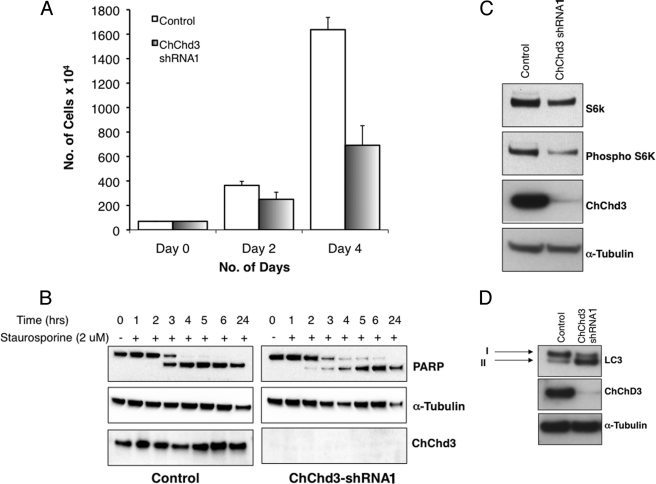
The mitochondrial inner membrane (IM) serves as the site for ATP production by hosting the oxidative phosphorylation complex machinery most notably on the crista membranes. Disruption of the crista structure has been implicated in a variety of cardiovascular and neurodegenerative diseases. Here, we characterize ChChd3, a previously identified PKA substrate of unknown function (Schauble, S., King, C. C., Darshi, M., Koller, A., Shah, K., and Taylor, S. S. (2007) J. Biol. Chem. 282, 14952-14959), and show that it is essential for maintaining crista integrity and mitochondrial function. In the mitochondria, ChChd3 is a peripheral protein of the IM facing the intermembrane space. RNAi knockdown of ChChd3 in HeLa cells resulted in fragmented mitochondria, reduced OPA1 protein levels and impaired fusion, and clustering of the mitochondria around the nucleus along with reduced growth rate. Both the oxygen consumption and glycolytic rates were severely restricted. Ultrastructural analysis of these cells revealed aberrant mitochondrial IM structures with fragmented and tubular cristae or loss of cristae, and reduced crista membrane. Additionally, the crista junction opening diameter was reduced to 50% suggesting remodeling of cristae in the absence of ChChd3. Analysis of the ChChd3-binding proteins revealed that ChChd3 interacts with the IM proteins mitofilin and OPA1, which regulate crista morphology, and the outer membrane protein Sam50, which regulates import and assembly of β-barrel proteins on the outer membrane. Knockdown of ChChd3 led to almost complete loss of both mitofilin and Sam50 proteins and alterations in several mitochondrial proteins, suggesting that ChChd3 is a scaffolding protein that stabilizes protein complexes involved in maintaining crista architecture and protein import and is thus essential for maintaining mitochondrial structure and function.


Figures

FIGURE 1.
FIGURE 1.
Domain organization and mitochondrial localization of ChChd3. A, amino acid sequence and exon organization of ChChd3. Different exons are shown in alternate black and gray colors. The myristoylation motif at the N terminus is underlined. The consensus site for the PKA phosphorylation is shown in the box, and the previously identified PKA phosphorylation site is underlined. The CX9C-CX9C motif cysteines in the chch domain are highlighted with asterisk. B, schematic diagram of the ChChd3 protein. DUF, domain of unknown function, CHCH, coiled-coil helix-coiled-coil helix domain. C and D, ChChd3 in mitochondria is primarily localized to the IM facing toward the IMS. Mouse liver mitochondrial subfractions were separated by SDS-PAGE and analyzed by immunoblotting by using antibodies against ChChd3 and known mitochondrial marker proteins. ChChd3 is enriched in the IM fraction similar to that of the IM marker protein, NDUFS3. M, matrix (C). SDS-PAGE and immunoblot analysis of trypsin-treated samples of mitochondria, swollen mitochondria, and submitochondrial particles (D).
FIGURE 2.
FIGURE 2.
Loss of ChChd3 in HeLa cells results in abnormal mitochondrial morphology. A, mitochondria in ChChd3 knockdown cells are clumpy, fragmented, and clustered around the nucleus. Representative confocal microscopic images of HeLa-control, control-shRNA, and ChChd3-shRNA HeLa cells expressing matrix-targeted RFP (mito-RFP). Two independent clones of ChChd3-shRNA (ChChd3-shRNA clone 1 and ChChd3-shRNA clone 2) were analyzed to avoid the selection artifacts. Scale bar, 10 μm. B, quantification of mitochondrial abnormalities in ChChd3 knockdown cells. 300 cells each from the control and ChChd3 knockdown cells were analyzed under confocal microscope for mitochondrial fragmentation and clumping. Mean ± S.D. from three independent experiments is shown. C, HeLa control, control-shRNA, and ChChd3-shRNA cell lysates were assessed for the changes in the protein levels of the key regulators of mitochondrial fusion and fission. ChChd3-shRNA1 and shRNA2 represent two different clones derived from a single shRNA sequence.
FIGURE 3.
FIGURE 3.
ChChd3 is required for mitochondrial fusion in HeLa cells. Inhibition of fission by K38A-Drp1 does not restore tubular mitochondrial network in the absence of ChChd3. Representative confocal micrographs of control-shRNA or ChChd3-shRNA HeLa cells expressing mito-RFP (red) and GFP or Drp1WTGFP or dominant negative mutant of Drp1, Drp1K38AGFP (green) are shown. Scale bars, 5 μm.
FIGURE 4.
FIGURE 4.
ChChd3 depletion impairs cellular bioenergetics. A and B, ChChd3 knockdown cells show a drastic decrease in the OCR and ECAR. OCR and ECAR were measured simultaneously by using the Seahorse extracellular flux analyzer in real time. Rates shown are the averages of four wells measured for 3 min after every 5 min. Also shown are the OCR and ECAR values after addition of 1 μm oligomycin, 200 nm carbonyl cyanide p-trifluoromethoxyphenylhydrazone (FCCP), and 100 nm rotenone + myxothiozol (Rot/Myx). C, cellular ATP levels in control-shRNA and ChChd3-shRNA HeLa cells were measured by luminescence-based CellTiter-Glo® cell viability assay. ATP levels were normalized to the protein levels. ChChd3-shRNA1 and shRNA2 represent two different clones derived from a single shRNA sequence, Error bars represent standard deviation from triplicate samples. p < 0.01.
FIGURE 5.
FIGURE 5.
Loss of ChChd3 results in crista remodeling and perinuclear clumping and fragmentation of mitochondria. A, EM analysis of control-shRNA and ChChd3-shRNA HeLa cells showed that mitochondria in ChChd3-shRNA cells cluster around the nucleus. Altered cristae and an increase in autophagy/mitophagy were also prevalent. Panel a, control-shRNA-expressing HeLa cells have mitochondria distributed throughout the cytoplasm. Panel b, in contrast, ChChd3-shRNA cells show clustering of mitochondria around the nucleus. Panel c, mitochondria of control cells have predominantly lamellar crista, whereas the mitochondria in the ChChd3 knockdown cells have lower crista density and more tubular crista (panel d). Panel e, common in these cells is mitochondria devoid or nearly devoid of cristae. Panel f, an autophagosome in a ChChd3 knockdown cell engulfing mitochondria. Panel g, multivesicular bodies are seen high in number in ChChd3 knockdown cells. B–I, quantification of mitochondrial abnormalities in ChChd3 knockdown cells from EM analysis of control and ChChd3 knockdown cells. ChChd3 knockdown cells have significantly reduced crista surface area (B), higher percentage of mitochondria without crista (C), and altered crista (D) with no change in number of cristae per mitochondria (E). B, bar graph showing the ratio of crista membrane surface area to the OM surface area in control and ChChd3 knockdown cells. OM surface area and the crista membrane surface area from 25 mitochondria each from control and ChChd3 knockdown cells were measured. p < 0.001. C, bar graph showing the percentage of mitochondria completely devoid of cristae measured from 10 different cells as the total number of mitochondria completely devoid of cristae in a cell divided by the total number of mitochondria in the cell. A total of 414 mitochondria in control and 822 mitochondria in ChChd3 knockdown cells were counted. p = 0.0015. D, bar graph showing the percentage of mitochondria with small and rounded cristae. Measured as above in C from 100 mitochondria from control and ChChd3 knockdown cells, 10 were randomly chosen from each cell from the same 10 cells used in C. p = 0.0015. The average number of cristae per mitochondria were counted from the same 10 cells and 100 mitochondria used in C–E. F–I, mitochondria in ChChd3 knockdown cells are fragmented and clustered around the nucleus. F, statistical analysis of the closest distance between the mitochondrial outer membrane and nuclear membrane. 448 mitochondria from five control cells and 339 mitochondria from five ChChd3 knockdown cells were used for measurements. p < 0.01. G, bar graph of the average number of mitochondria per μm2 in control and ChChd3 knockdown HeLa cells. The number of mitochondria per cell was measured as the number/cytoplasm cross-sectional area for 10 cells each of control and ChChd3 knockdown. There were a total of 414 mitochondria in the control cells and 822 mitochondria in the knockdown cells. p = 0.019. H, bar graph of quantification of mitochondrial volume over total cytoplasmic volume measured from 10 cells each of control and ChChd3 knockdown. I, bar graph of average length of mitochondria measured from the same 10 cells used in H. 165 mitochondria from each control and ChChd3 knockdown were measured. p < 0.001. Means ± S.E. used throughout.
FIGURE 6.
FIGURE 6.
Electron tomography reveals that crista junctions in ChChd3 knockdown mitochondria are smaller than those in control mitochondria. a, 2.4-nm-thick slice through the tomographic volume of a control mitochondrion. Control mitochondria are generally longer than their ChChd3 knockdown counterpart. Two crista junctions are shown (arrowheads) with the one at bottom having a very large opening. Scale bar, 200 nm and applies to all panels. b, 2.4-nm thick slice through the tomographic volume of five ChChd3 knockdown mitochondria. These mitochondria are generally smaller and often found close to each other suggesting fission has occurred. The amount of cristae present can differ remarkably (compare L, similar cristae complement to control mitochondria, with M, tiny mitochondrion devoid of cristae), and the matrix density can also differ substantially (compare M with R). Their crista junction openings are characteristically smaller (arrowheads). c and d, side views of a segmented and surface-rendered inner membrane from a control mitochondrial volume with numbered crista junctions. Six crista junctions are shown on one side and nine on the other side. e and f, side views of a segmented and surface-rendered inner membrane from a ChChd3 knockdown mitochondrial volume showing smaller crista junctions (numbered) than the control. Six crista junctions are shown on one side and four on the other side. g, crista junction openings in ChChd3 knockdown mitochondria are about half the size of control openings. The mean crista junction width at its largest opening in tomographic reconstructions is compared. The number of measurements is shown above each bar. Error bar, S.E. (**, p < 0.01). h, density of crista junctions is no different in control and ChChd3 knockdown mitochondria. The total number of crista junctions per mitochondrial volume was counted and divided by the mitochondrial surface area derived from the tomographic volume to determine the crista junction density. Error bar, S.E.
FIGURE 7.
FIGURE 7.
ChChd3 interacts with Mitofilin, Sam50, HSP70, and OPA1. A–C, FLAG-tagged ChChd3 (A), mitofilin (B), and Sam50 (C) were transiently expressed in HEK293 cells and immunoprecipitated (IP) with FLAG resin. Eluted samples were analyzed on SDS-PAGE followed by immunoblot (IB) with the indicated antibodies. D, ChChd3 binds to mitofilin through the chch domain and to Sam50 through N-terminal myristoylation or myristoylated confirmation. E–H, ChChd3 and mitofilin preferentially interact with the shorter isoform of OPA1 in HEK293 cells (E–G) and in mitochondria (H). FLAG-tagged full-length WT ChChd3 (E) or FLAG-tagged mitofilin (F) or ChChd3 mutant proteins (G) were expressed in HEK293 cells and immunoprecipitated with FLAG resin. Sam50 levels are not shown in the input as the antibodies available for Sam50 failed to detect endogenous protein in total cell lysates of HEK293 cells. H, ChChd3 protein, immunoprecipitated from mouse liver mitochondria by using ChChd3 antibody, binds efficiently with mitofilin and the soluble IMS isoform of OPA1. 5% of the total input is shown throughout. I, proposed model for localization of ChChd3 in mitochondria. ChChd3 is synthesized in the cytoplasm and kept in a reduced and soluble form with the help of HSP70, before it is imported and folded in the mitochondria. In mitochondria, ChChd3 may exist at two discrete foci: 1) at CJ and (2) at contact sites (CS). At the CJs, ChChd3 would form a complex with mitofilin and OPA1, and at the contact sites it would associate with mitofilin and Sam50 thereby influencing the regulation of crista biogenesis and mitochondrial protein import, respectively. MF, mitofilin; IBM, inner boundary membrane.
FIGURE 8.
FIGURE 8.
Depletion of ChChd3 leads to major loss of mitofilin and Sam50 and reduction in specific mitochondrial proteins. A, equal amounts of protein from control and ChChd3 knockdown HeLa cell lysates were analyzed on the immunoblot against the antibodies indicated. Protein load was normalized against tubulin. B, ChChd3 knockdown cells show reduced levels of mitochondrial inner membrane proteins AIF, prohibitin, Cox-IV, and Cox-II and the outer membrane protein VDAC. Cytoplasmic and mitochondrial fractions from control and ChChd3 knockdown cells were separated as described under “Experimental Procedures,” and equal amounts of protein (15 μg) from each of these fractions were analyzed on SDS-PAGE followed by Western blotting. HSP90 and MFN1 were used as loading controls for cytoplasmic and mitochondrial fractions, respectively. ChChd3-shRNA1 and shRNA2 represent two different clones derived from a single shRNA sequence.
FIGURE 9.
FIGURE 9.
Loss of ChChd3 results in reduced cellular proliferation. A, rate of cellular proliferation in control and ChChd3 knockdown cells measured by plating an equal number of cells and counting them periodically for 4 days. Error bars represent standard deviation from triplicate samples. B, reduced growth rate is not due to the increased apoptosis or sensitivity toward apoptosis in ChChd3 knockdown cells. Control and ChChd3 knockdown cells were treated with staurosporine to induce apoptosis, and the cells were lysed after the indicated time periods and analyzed for the changes in poly(ADP-ribose) polymerase (PARP) cleavage. C, ChChd3 knockdown cells show reduced p70 S6 kinase (S6k) and phospho-p70 S6 kinase protein levels. Equal amounts of protein from the control and ChChd3 knockdown cells were analyzed for p70 S6 kinase and phospho-p70 S6 kinase. D, ChChd3 knockdown cells show elevated autophagy. Equal amounts of protein from the total cell lysates of control and ChChd3 knockdown cells were separated on a SDS-PAGE and immunoblotted against LC3 antibody. Tubulin is used as the loading control.

Similar articles

Cited by

References

    1. Chan D. C. (2006) Annu. Rev. Cell Dev. Biol. 22, 79–99 - PubMed
    1. Hoppins S., Lackner L., Nunnari J. (2007) Annu. Rev. Biochem. 76, 751–780 - PubMed
    1. Chen H., Detmer S. A., Ewald A. J., Griffin E. E., Fraser S. E., Chan D. C. (2003) J. Cell Biol. 160, 189–200 - PMC - PubMed
    1. Olichon A., Emorine L. J., Descoins E., Pelloquin L., Brichese L., Gas N., Guillou E., Delettre C., Valette A., Hamel C. P., Ducommun B., Lenaers G., Belenguer P. (2002) FEBS Lett. 523, 171–176 - PubMed
    1. Smirnova E., Griparic L., Shurland D. L., van der Bliek A. M. (2001) Mol. Biol. Cell 12, 2245–2256 - PMC - PubMed

Publication types

MeSH terms