. 2011 Mar;39(6):2032-44.
doi: 10.1093/nar/gkq1161. Epub 2010 Nov 16.

Extensive role of the general regulatory factors, Abf1 and Rap1, in determining genome-wide chromatin structure in budding yeast

Affiliations

Extensive role of the general regulatory factors, Abf1 and Rap1, in determining genome-wide chromatin structure in budding yeast

Mythily Ganapathi et al. Nucleic Acids Res. 2011 Mar.

Abstract

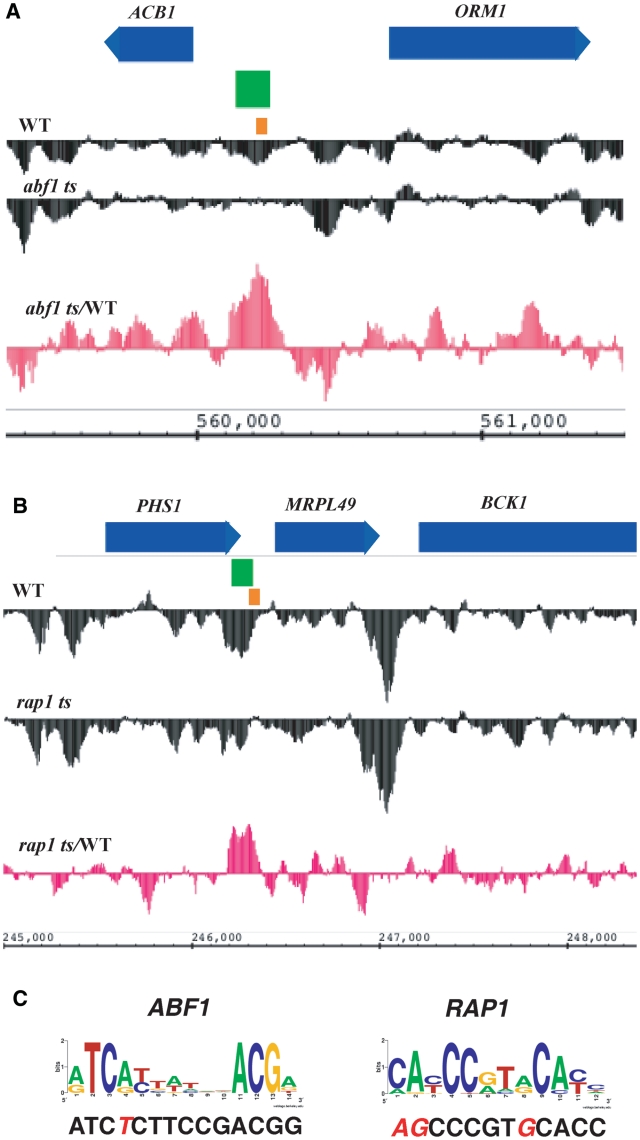
The packaging of eukaryotic DNA into chromatin has profound consequences for gene regulation, as well as for other DNA transactions such as recombination, replication and repair. Understanding how this packaging is determined is consequently a pressing problem in molecular genetics. DNA sequence, chromatin remodelers and transcription factors affect chromatin structure, but the scope of these influences on genome-wide nucleosome occupancy patterns remains uncertain. Here, we use high resolution tiling arrays to examine the contributions of two general regulatory factors, Abf1 and Rap1, to nucleosome occupancy in Saccharomyces cerevisiae. These factors have each been shown to bind to a few hundred promoters, but we find here that thousands of loci show localized regions of altered nucleosome occupancy within 1 h of loss of Abf1 or Rap1 binding, and that altered chromatin structure can occur via binding sites having a wide range of affinities. These results indicate that DNA-binding transcription factors affect chromatin structure, and probably dynamics, throughout the genome to a much greater extent than previously appreciated.


Figures

Figure 1.
Figure 1.
Select genomic regions showing altered nucleosome occupancy profiles in wild-type and abf1 ts (A and B) or rap1 ts yeast (C–F). Relative nucleosome occupancy (black traces) is represented as the log2 of (nucleosomal DNA/genomic DNA) signal intensity ratio. For each region, blue bars at top show open reading frames, with introns shown as thin lines, pointing to right or left for those on the Watson or Crick strand, respectively (PIM1 extends beyond the left edge of the region shown); green boxes indicate regions identified as having significantly altered nucleosome occupancy in ts mutant yeast; small orange boxes above nucleosome occupancy profiles indicate binding sites for Abf1 or Rap1; and chromosomal coordinates are indicated at bottom. Note that the region in the vicinity of the Abf1-binding site upstream of YDL102C (B) did not show significantly altered nucleosome occupancy with the parameters used in the Tiling Array Software program; nonetheless, a modest increase in occupancy is seen at this region.
Figure 2.
Figure 2.
Indirect end-labeling analysis of chromatin structure at the RPL42A promoter (A) in wild-type and rap1 ts yeast, (B) in wild-type and hmo1Δ yeast, and (C) in wild-type, ifh1Δ, and ifh1Δ fhl1Δ yeast. Increasing amounts of MNase were used, from 0 to 20 U/ml (triangles), to digest chromatin prepared from the indicated strains after 1 h at 37°C (A) or grown at 30°C (B and C), and to digest naked DNA (lanes N). MNase cleavage sites were mapped relative to a BamHI site at +245 bp. Cleavage sites characteristic of chromatin from wild-type cells are indicated by small circles, with a prominent cleavage indicated by the red arrow, while cleavages characteristic of the ts mutant are indicated by stars. Note the presence of the former and absence of the latter cleavages in hmo1Δ, ifh1Δ and ifh1Δ fhl1Δ yeast in (B and C).
Figure 3.
Figure 3.
Averaged nucleosome occupancy profiles for (A) 67 promoter regions surrounding unique Abf1 sites from genes identified as probable or putative targets of Abf1 (23), in abf1 ts and WT yeast; (B) 66 promoter regions surrounding unique Rap1 sites from genes identified as probable or putative targets of Rap1 (23), in rap1 ts and WT yeast; (C and D) 30 promoter regions having unique Rap1-binding sites located <300 bp or >300 bp from the TSS, respectively, centered on Rap1-binding sites, in rap1 ts and WT yeast.
Figure 4.
Figure 4.
K-means clustering (K = 7) for log2 of nucleosome occupancy for (A) abf1 ts yeast and (C) rap1 ts over WT for 7052 genes, aligned by TSS; yellow represents increased nucleosome occupancy in the ts mutant, while blue represents depletion. Line graphs for average nucleosome occupancy of indicated clusters are depicted in (B) and (D); line graphs for Abf1 cluster 3 and Rap1 cluster 6, used as controls for enrichment, are shown in Supplementary Figure S4B and C. Clustering for K = 6 or K = 8 yielded similar results, with some clusters being grouped together or sub-divided further (Supplementary Figure S10).
Figure 5.
Figure 5.
Regions having altered nucleosome occupancy in abf1 ts or rap1 ts yeast are enriched for both strong and weak Abf1 and Rap1-binding sites. Graphs of genes ranked by log(P) for ChIP against (A) Abf1 or (C) Rap1 (53) are shown, with promoters containing regions having significantly changed nucleosome occupancy, and associated with divergent or tandem promoters, indicated by pink squares and yellow triangles, respectively. Regions found to lie in divergent promoters were mapped to only one of the two divergently transcribed genes. Insets show the relative enrichment of promoters having altered nucleosome occupancy in ts mutant yeast against the log(P) for ChIP for Abf1 or Rap1, for increments of log(P) of 1/10. This was calculated by determining the fraction of promoters having altered nucleosome occupancy for each increment of log(P) and dividing by the fraction of all promoters having log(P) in the same increment. The horizontal dashed lines correspond to a value of 1, or no enrichment. In (B) and (D) are shown the fraction of genes showing altered nucleosome occupancy in abf1 or rap1 ts yeast, respectively, that contain Abf1 or Rap1 motifs defined stringently [motif score >7 in Patser (66), corresponding approximately to ln(P) < –9.5] or loosely [motif score >5, corresponding approximately to ln(P) < –8], as indicated, and having ChIP log(P) values as indicated at bottom. Control sets were closely matched for ChIP P-values but did not show altered nucleosome occupancy according to the criteria applied ('Materials and Methods' section), while the ‘low ChIP control’ was a group of genes at about 75th percentile for ChIP P-value.
Figure 6.
Figure 6.
Nucleosome occupancy profiles in the region of the ORM1 gene in WT and abf1 ts yeast (A) and in the region of the MRPL49 gene in WT and rap1 ts yeast (B); see Figure 1 legend for additional details. (C) Motifs found in the regions of altered nucleosome occupancy in (A and B) [orange boxes in (A and B)] are compared to logos for the Abf1 and Rap1 consensus motifs (23); differences are highlighted by red italic letters.

Similar articles

Cited by

References

    1. Owen-Hughes T, Workman JL. Experimental analysis of chromatin function in transcription control. Crit. Rev. Eukaryot. Gene Expr. 1994;4:403–441. - PubMed
    1. Simpson RT. Nucleosome positioning: occurrence, mechanisms, and functional consequences. Prog. Nucleic Acid Res. Mol. Biol. 1991;40:143–184. - PubMed
    1. Thoma F. Nucleosome positioning. Biochim. Biophys. Acta. 1992;1130:1–19. - PubMed
    1. Radman-Livaja M, Rando OJ. Nucleosome positioning: how is it established, and why does it matter? Dev. Biol. 2010;339:258–266. - PMC - PubMed
    1. Hirschhorn JN, Brown SA, Clark CD, Winston F. Evidence that SNF2/SWI2 and SNF5 activate transcription in yeast by altering chromatin structure. Genes Dev. 1992;6:2288–2298. - PubMed

Publication types

MeSH terms