

Nuclear import of histone deacetylase 5 by requisite nuclear localization signal phosphorylation
- PMID: 21081666
- PMCID: PMC3033682
- DOI: 10.1074/mcp.M110.004317
Nuclear import of histone deacetylase 5 by requisite nuclear localization signal phosphorylation
Abstract
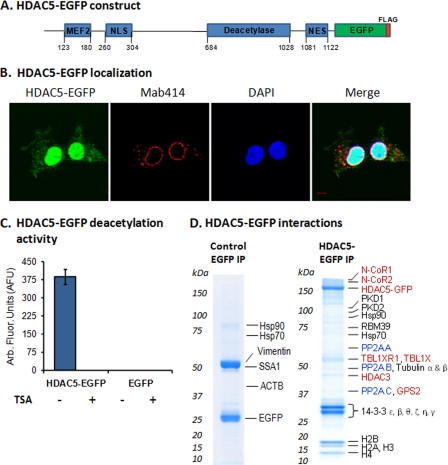
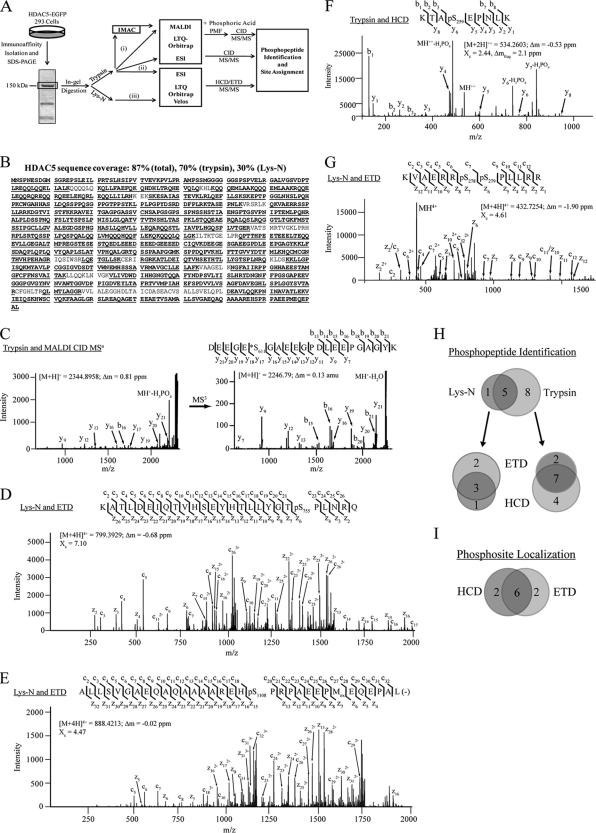
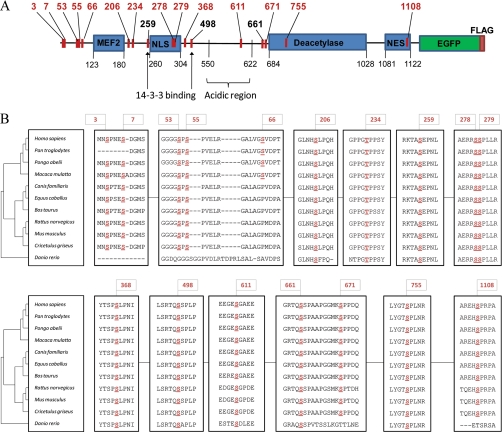
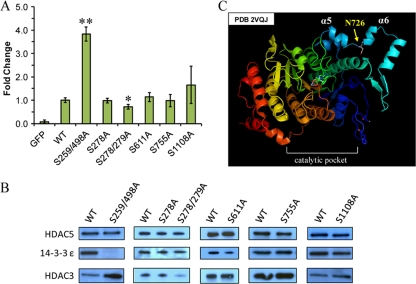
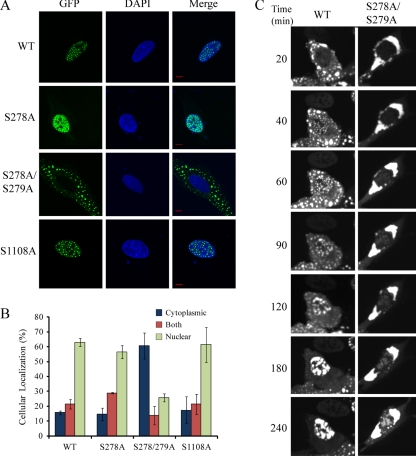
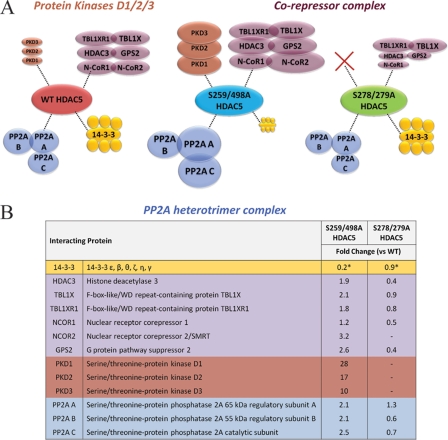
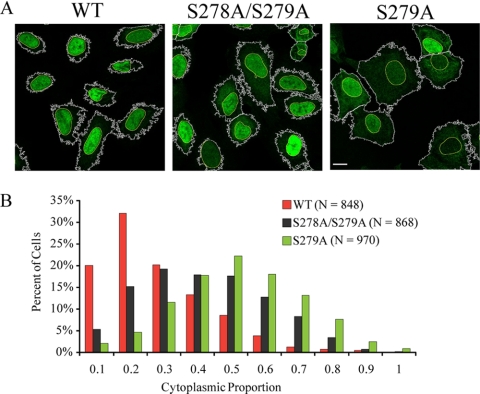
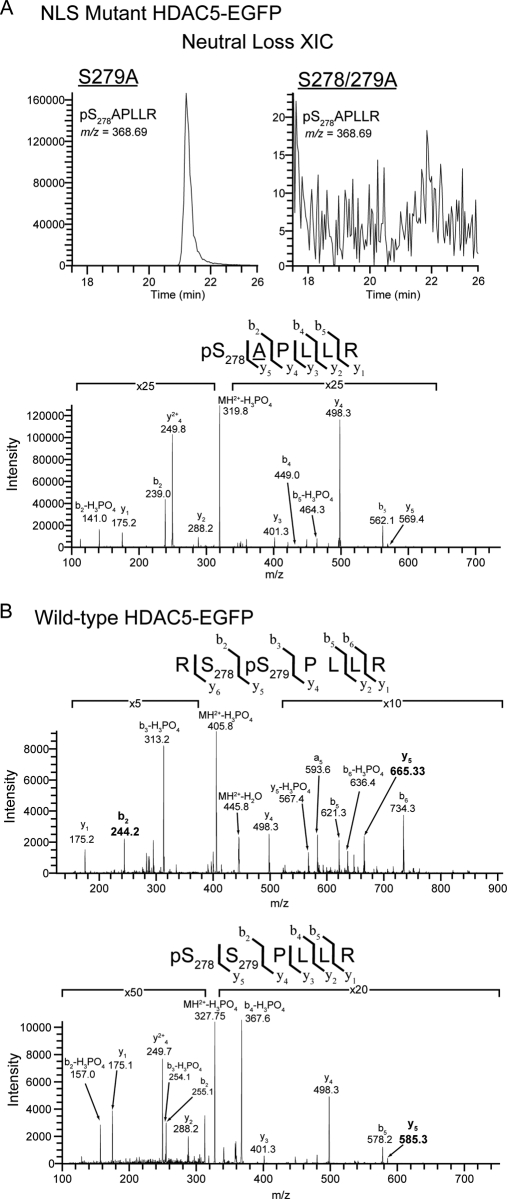
Histone deacetylase 5 (HDAC5), a class IIa deacetylase, is a prominent regulator of cellular and epigenetic processes that underlie the progression of human disease, ranging from cardiac hypertrophy to cancer. Although it is established that phosphorylation mediates 14-3-3 protein binding and provides the essential link between HDAC5 nucleo-cytoplasmic shuttling and transcriptional repression, thus far only four phospho-acceptor sites have been functionally characterized. Here, using a combinatorial proteomics approach and phosphomutant screening, we present the first evidence that HDAC5 has at least 17 in vivo phosphorylation sites within functional domains, including Ser278 and Ser279 within the nuclear localization signal (NLS), Ser1108 within the nuclear export signal, and Ser755 in deacetylase domain. Global and targeted MS/MS analyses of NLS peptides demonstrated the presence of single (Ser278 and Ser279) and double (Ser278/Ser279) phosphorylations. The double S278/279A mutation showed reduced association with HDAC3, slightly decreased deacetylation activity, and significantly increased cytoplasmic localization compared with wild type HDAC5, whereas the S278A and S1108A phosphomutants were not altered. Live cell imaging revealed a deficiency in nuclear import of S278/279A HDAC5. Phosphomutant stable cell lines confirmed the cellular redistribution of NLS mutants and revealed a more pronounced cytoplasmic localization for the single S279A mutant. Proteomic analysis of immunoisolated S278/279A, S279A, and S259/498A mutants linked altered cellular localization to changes in protein interactions. S278/279A and S279A HDAC5 showed reduced association with the NCoR-HDAC3 nuclear corepressor complex as well as protein kinase D enzymes, which were potentiated in the S259/498A mutant. These results provide the first link between phosphorylation outside the known 14-3-3 sites and downstream changes in protein interactions. Together these studies identify Ser279 as a critical phosphorylation within the NLS involved in the nuclear import of HDAC5, providing a regulatory point in nucleo-cytoplasmic shuttling that may be conserved in other class IIa HDACs-HDAC4 and HDAC9.
Figures
Similar articles
-
Probing phosphorylation-dependent protein interactions within functional domains of histone deacetylase 5 (HDAC5).Proteomics. 2014 Oct;14(19):2156-66. doi: 10.1002/pmic.201400092. Epub 2014 Jul 24. Proteomics. 2014. PMID: 24920159 Free PMC article.
-
Protein kinase C-related kinase targets nuclear localization signals in a subset of class IIa histone deacetylases.FEBS Lett. 2010 Mar 19;584(6):1103-10. doi: 10.1016/j.febslet.2010.02.057. Epub 2010 Feb 24. FEBS Lett. 2010. PMID: 20188095
-
β-Adrenergic Stimulation Induces Histone Deacetylase 5 (HDAC5) Nuclear Accumulation in Cardiomyocytes by B55α-PP2A-Mediated Dephosphorylation.J Am Heart Assoc. 2017 Mar 25;6(4):e004861. doi: 10.1161/JAHA.116.004861. J Am Heart Assoc. 2017. PMID: 28343149 Free PMC article.
-
14-3-3 regulates the nuclear import of class IIa histone deacetylases.Biochem Biophys Res Commun. 2008 Dec 19;377(3):852-6. doi: 10.1016/j.bbrc.2008.10.079. Epub 2008 Oct 24. Biochem Biophys Res Commun. 2008. PMID: 18952052
-
Class II histone deacetylases: structure, function, and regulation.Biochem Cell Biol. 2001;79(3):243-52. Biochem Cell Biol. 2001. PMID: 11467738 Review.
Cited by
-
Proteomics-based methods for discovery, quantification, and validation of protein-protein interactions.Anal Chem. 2013 Jan 15;85(2):749-68. doi: 10.1021/ac3033257. Epub 2012 Dec 12. Anal Chem. 2013. PMID: 23157382 Free PMC article. Review. No abstract available.
-
A mass spectrometry view of stable and transient protein interactions.Adv Exp Med Biol. 2014;806:263-82. doi: 10.1007/978-3-319-06068-2_11. Adv Exp Med Biol. 2014. PMID: 24952186 Free PMC article. Review.
-
Modulation of hepatitis B virus pregenomic RNA stability and splicing by histone deacetylase 5 enhances viral biosynthesis.PLoS Pathog. 2020 Aug 21;16(8):e1008802. doi: 10.1371/journal.ppat.1008802. eCollection 2020 Aug. PLoS Pathog. 2020. PMID: 32822428 Free PMC article.
-
Identification of staphylococcal nuclease domain-containing 1 (SND1) as a Metadherin-interacting protein with metastasis-promoting functions.J Biol Chem. 2011 Jun 3;286(22):19982-92. doi: 10.1074/jbc.M111.240077. Epub 2011 Apr 8. J Biol Chem. 2011. PMID: 21478147 Free PMC article.
-
HDAC5 controls MEF2C-driven sclerostin expression in osteocytes.J Bone Miner Res. 2015 Mar;30(3):400-11. doi: 10.1002/jbmr.2381. J Bone Miner Res. 2015. PMID: 25271055 Free PMC article.
References
-
- Berger S. L. (2007) The complex language of chromatin regulation during transcription. Nature. 447, 407–412 - PubMed
-
- Renthal W., Maze I., Krishnan V., Covington H. E., 3rd, Xiao G., Kumar A., Russo S. J., Graham A., Tsankova N., Kippin T. E., Kerstetter K. A., Neve R. L., Haggarty S. J., McKinsey T. A., Bassel-Duby R., Olson E. N., Nestler E. J. (2007) Histone deacetylase 5 epigenetically controls behavioral adaptations to chronic emotional stimuli. Neuron. 56, 517–529 - PubMed
-
- Bossuyt J., Helmstadter K., Wu X., Clements-Jewery H., Haworth R. S., Avkiran M., Martin J. L., Pogwizd S. M., Bers D. M. (2008) Ca2+/calmodulin-dependent protein kinase IIdelta and protein kinase D overexpression reinforce the histone deacetylase 5 redistribution in heart failure. Circ. Res. 102, 695–702 - PubMed
-
- Takami Y., Nakayama T. (2000) N-terminal region, C-terminal region, nuclear export signal, and deacetylation activity of histone deacetylase-3 are essential for the viability of the DT40 chicken B cell line. J. Biol. Chem. 275, 16191–16201 - PubMed
Publication types
MeSH terms
Substances
Grants and funding
LinkOut - more resources
Full Text Sources
Other Literature Sources
Molecular Biology Databases
