. 2011 Feb;300(2):E410-21.
doi: 10.1152/ajpendo.00463.2010. Epub 2010 Nov 16.

Dipeptidyl peptidase IV inhibitor sitagliptin reduces local inflammation in adipose tissue and in pancreatic islets of obese mice

Affiliations

Dipeptidyl peptidase IV inhibitor sitagliptin reduces local inflammation in adipose tissue and in pancreatic islets of obese mice

A D Dobrian et al. Am J Physiol Endocrinol Metab. 2011 Feb.

Abstract

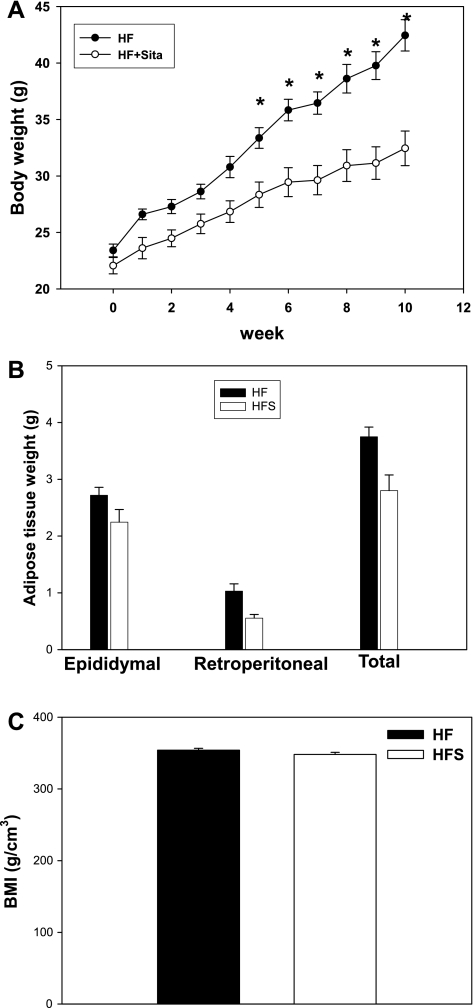
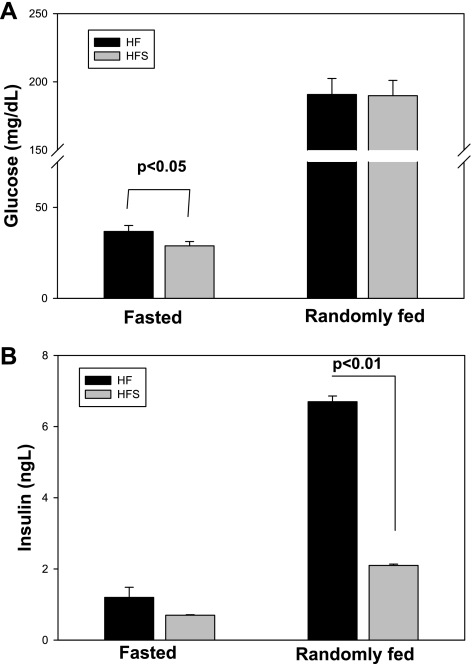
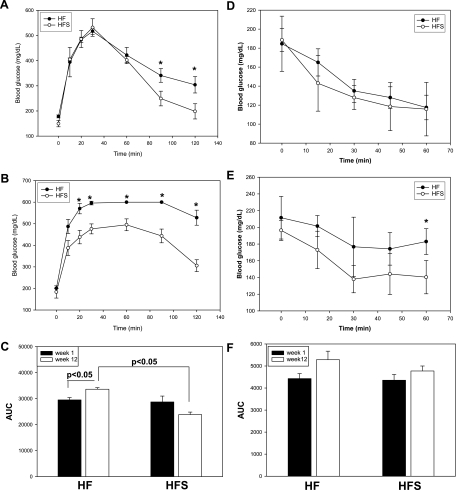
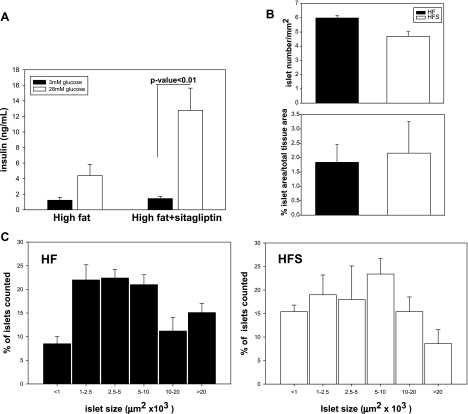
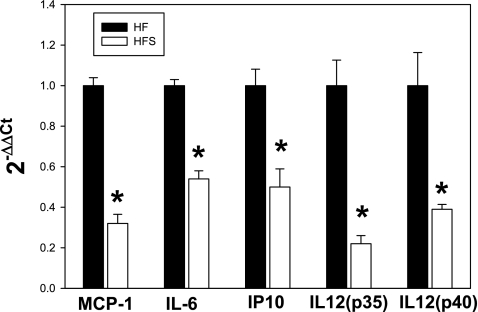
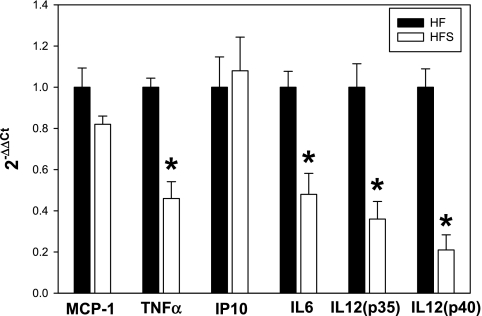
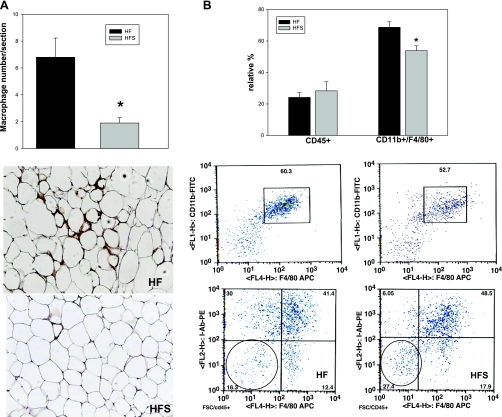
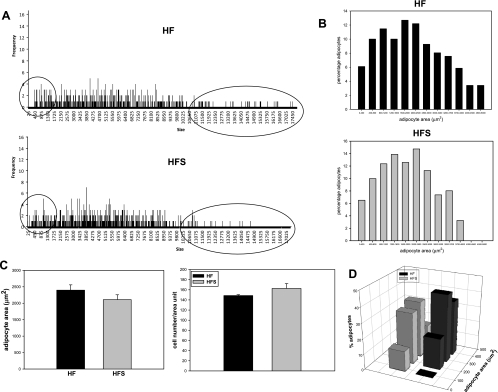
Adipose tissue inflammation and reduced pancreatic β-cell function are key issues in the development of cardiovascular disease and progressive metabolic dysfunction in type 2 diabetes mellitus. The aim of this study was to determine the effect of the DPP IV inhibitor sitagliptin on adipose tissue and pancreatic islet inflammation in a diet-induced obesity model. C57Bl/6J mice were placed on a high-fat (60% kcal fat) diet for 12 wk, with or without sitagliptin (4 g/kg) as a food admix. Sitagliptin significantly reduced fasting blood glucose by 21% as well as insulin by ∼25%. Sitagliptin treatment reduced body weight without changes in overall body mass index or in the epididymal and retroperitoneal fat mass. However, sitagliptin treatment led to triple the number of small adipocytes despite reducing the number of the very large adipocytes. Sitagliptin significantly reduced inflammation in the adipose tissue and pancreatic islet. Macrophage infiltration in adipose tissue evaluated by immunostaining for Mac2 was reduced by sitagliptin (P < 0.01), as was the percentage of CD11b+/F4/80+ cells in the stromal vascular fraction (P < 0.02). Sitagliptin also reduced adipocyte mRNA expression of inflammatory genes, including IL-6, TNFα, IL-12(p35), and IL-12(p40), 2.5- to fivefold as well as 12-lipoxygenase protein expression. Pancreatic islets were isolated from animals after treatments. Sitagliptin significantly reduced mRNA expression of the following inflammatory cytokines: MCP-1 (3.3-fold), IL-6 (2-fold), IL-12(p40) (2.2-fold), IL-12(p35) (5-fold, P < 0.01), and IP-10 (2-fold). Collectively, the results indicate that sitagliptin has anti-inflammatory effects in adipose tissue and in pancreatic islets that accompany the insulinotropic effect.


Figures

Fig. 1.
Fig. 1.
Effect of sitagliptin on body weight and adiposity. A: weekly measurements of body weight in mice on high-fat diets with or without sitagliptin treatment. B: weight of total visceral fat and of the 2 major visceral depots (epididymal and retroperitoneal). C: body mass index (BMI) calculated according to the following formula: [3√BW (g)/length (mm)] × 104. Data are from n = 10 mice/group and expressed as means ± SE; the null hypothesis was rejected for a P value <0.05. HF, control group on high fat; HFS, sitagliptin-treated group; HF + Sita, mice on HF diet with sitagliptin treatment. *Statistically significant compared with HFS.
Fig. 2.
Fig. 2.
Effect of sitagliptin treatment on plasma glucose and insulin. A: fasted and fed plasma glucose were determined using a glucometer as baseline values in the insulin and glucose tolerance tests and at the end of the study. B: plasma insulin concentration was determined at the end of the study by immunoassay. Results are from n = 12–14 mice/group and expressed as means ± SE.
Fig. 3.
Fig. 3.
Glucose (GTT) and insulin tolerance tests (ITT) in control diet alone and with sitagliptin treatment groups. GTT was determined in mice with or without sitagliptin treatment after the 1st week of diet (A) and during the last week (week 12; B). Results are expressed as blood glucose concentration (mg/dl). C: areas under the curve (AUC) were calculated based on the GTT curves. ITT was measured in randomly fed mice at week 1 (D) and at week 12 (E) of the study. Results are expressed as blood glucose concentration (mg/dl). F: AUC was calculated based on the respective ITT curves. Results are from n = 12–14 mice/group and expressed as means ± SE. *Statistically significant (P < 0.05) compared with HFS group.
Fig. 4.
Fig. 4.
Pancreatic islet function and morphometry. A: sitagliptin treatment improves in vitro glucose-stimulated insulin secretion in islets. Islets were treated with 3 mmol/l glucose for 1 h, followed by 28 mmol/l glucose for an additional hour. Insulin was measured in medium at both time points using an ELISA kit. Fifty islets were measured in each condition and assayed in triplicate. Data are expressed as means ± SE from 5 mice/group. Islet morphometry was determined in paraffin-embedded pancreatic sections stained with hematoxylin and eosin. B: islet size and number were not significantly changed by sitagliptin treatment. C: islet size distribution shows that sitagliptin treatment tends to reduce the number of hyperplasic islets (area >0.02 mm2), whereas it increases the number of small islets. Data represent means ± SE from 5 mice/group.
Fig. 5.
Fig. 5.
Sitagliptin treatment reduces inflammatory cytokine expression in pancreatic islets. Data are normalized to β-actin, and the fold change in expression in the sitagliptin vs. control group was calculated using the 2−ΔΔCT method. Results are from n = 7–10 mice/group. MCP-1, monocyte chemoattractant protein-1. *Statistically significant (P < 0.05) compared with HF group.
Fig. 6.
Fig. 6.
Sitagliptin reduces proinflammatory cytokine expression in adipocytes. Adipocytes were isolated from total epididymal tissue by collagenase digestion, and gene expression was analyzed by real-time PCR. Data are normalized to β-actin, and the fold change in expression in the sitagliptin vs. control group was calculated using the 2−ΔΔCT method. Results are from n = 7–10 mice/group. *Statistically significant (P < 0.05) compared to HF group.
Fig. 7.
Fig. 7.
Sitagliptin reduces 12-lipoxygenase (12-LO) mRNA expression in adipocytes (A) and reduces protein expression in adipose tissue (B). 12-LO expression was quantified by real-time PCR using specific primers and normalized to β-actin. Results are expressed as the mean of 1/ΔCT ± SE from n = 5 mice/group. Paraffin-embedded adipose tissue sections were immunostained using a 12-LO antibody. Representative immunostaining illustrates reduction of the immunostaining frequency in the sitagliptin-treated sample. Immunostaining is possibly associated with both the immune cells in the crown-like structures (solid arrows) and adipocytes (dotted arrows). Intensity of staining was quantified using the Metamorph software and expressed as relative units of intensity normalized to area analyzed/section. A number of 4–6 sections from 4 mice/group were analyzed. Data are expressed as means ± SE.
Fig. 8.
Fig. 8.
Sitagliptin reduces macrophage infiltration in adipose tissue after high-fat feeding. A: immunostaining using MAC2 antibody was performed in 5–6 mice/group and quantified as described in experimental procedures. Sitagliptin reduces the MAC2 immunostaining and crown-like structures in adipose tissue of high-fat-fed mice. B: flow cytometry of stromal vascular fraction obtained following collagenase digestion of epididymal adipose tissue. Macrophages were identified as double-positive CD11b/F4/80 cells gated for CD45. The lymphoid cells were determined as F4/80/I-Ab double-negative cells gated for CD45. Representative plots are shown. Quantification was performed on samples from n = 5 mice/group and expressed as relative percentage of cells normalized to adipose tissue weight. *Statistically significant (P < 0.05) compared with HF group.
Fig. 9.
Fig. 9.
Effect of sitagliptin on adipocyte morphometry. Sitagliptin reduces the number of very large adipocytes, whereas it increases the number of small adipocytes. A: representative graphs indicating the size distribution of the measured cells. B: size distribution histograms from 3–5 mice/group. C: adipocyte area and cell number were measured in 3–5 mice/group. D: distribution of the very small adipocyte population measured in 3–5 mice/group.

Similar articles

Cited by

References

    1. Aaboe K, Knop FK, Vilsboll T, Deacon CF, Holst JJ, Madsbad S, Krarup T. Twelve weeks treatment with the DPP-4 inhibitor, sitagliptin, prevents degradation of peptide YY and improves glucose and non-glucose induced insulin secretion in patients with type 2 diabetes mellitus. Diabetes Obes Metab 12: 323–333, 2010 - PubMed
    1. Ahren B. Dipeptidyl peptidase-4 inhibitors: clinical data and clinical implications. Diabetes Care 30: 1344–1350, 2007 - PubMed
    1. Ahren B, Holst JJ, Martensson H, Balkan B. Improved glucose tolerance and insulin secretion by inhibition of dipeptidyl peptidase IV in mice. Eur J Pharmacol 404: 239–245, 2000 - PubMed
    1. Allen TL, Febbraio MA. IL6 as a mediator of insulin resistance: fat or fiction? Diabetologia 53: 399–402, 2010 - PubMed
    1. Andersson CX, Gustafson B, Hammarstedt A, Hedjazifar S, Smith U. Inflamed adipose tissue, insulin resistance and vascular injury. Diabetes Metab Res Rev 24: 595–603, 2008 - PubMed

Publication types

MeSH terms