

Verification of IMRT dose calculations using AAA and PBC algorithms in dose buildup regions
- PMID: 21081894
- PMCID: PMC5720424
- DOI: 10.1120/jacmp.v11i4.3351
Verification of IMRT dose calculations using AAA and PBC algorithms in dose buildup regions
Abstract
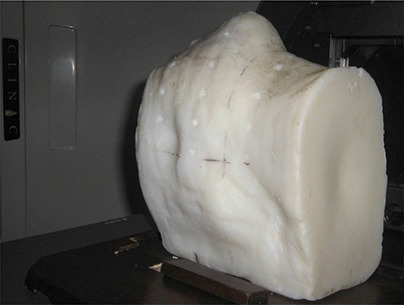
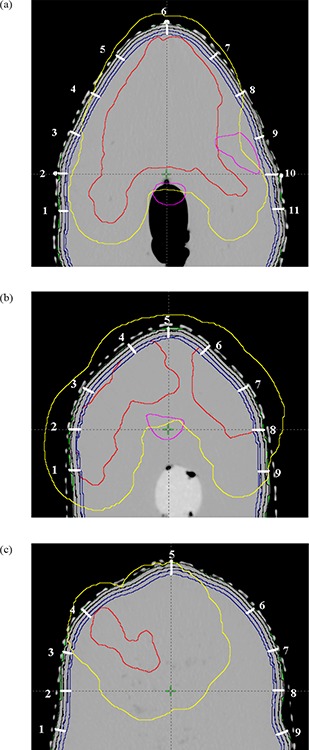
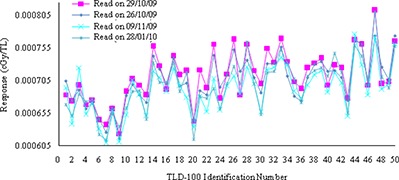
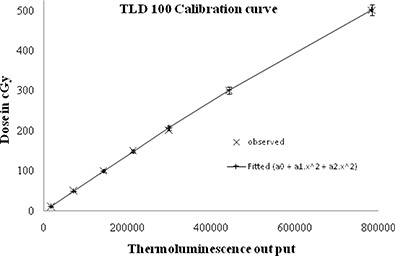
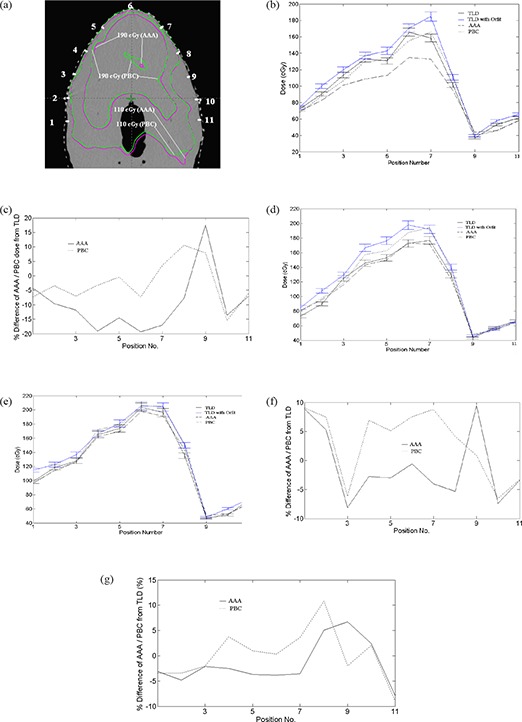
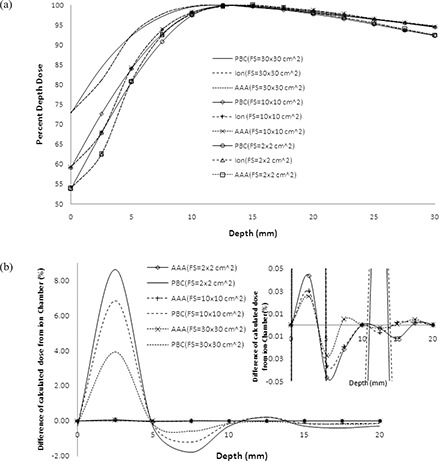
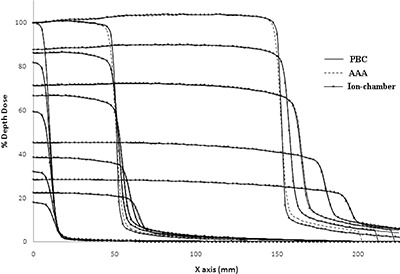
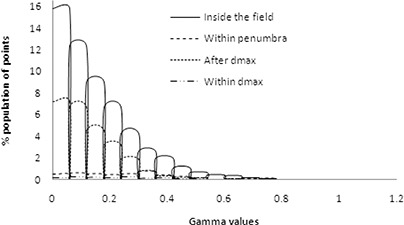
The purpose of this comparative study was to test the accuracy of anisotropic analytical algorithm (AAA) and pencil beam convolution (PBC) algorithms of Eclipse treatment planning system (TPS) for dose calculations in the low- and high-dose buildup regions. AAA and PBC algorithms were used to create two intensity-modulated radiotherapy (IMRT) plans of the same optimal fluence generated from a clinically simulated oropharynx case in an in-house fabricated head and neck phantom. The TPS computed buildup doses were compared with the corresponding measured doses in the phantom using thermoluminescence dosimeters (TLD 100). Analysis of dose distribution calculated using PBC and AAA shows an increase in gamma value in the dose buildup region indicating large dose deviation. For the surface areas of 1, 50 and 100 cm2, PBC overestimates doses as compared to AAA calculated value in the range of 1.34%-3.62% at 0.6 cm depth, 1.74%-2.96% at 0.4 cm depth, and 1.96%-4.06% at 0.2 cm depth, respectively. In high-dose buildup region, AAA calculated doses were lower by an average of -7.56% (SD = 4.73%), while PBC was overestimated by 3.75% (SD = 5.70%) as compared to TLD measured doses at 0.2 cm depth. However, at 0.4 and 0.6 cm depth, PBC overestimated TLD measured doses by 5.84% (SD = 4.38%) and 2.40% (SD = 4.63%), respectively, while AAA underestimated the TLD measured doses by -0.82% (SD = 4.24%) and -1.10% (SD = 4.14%) at the same respective depth. In low-dose buildup region, both AAA and PBC overestimated the TLD measured doses at all depths except -2.05% (SD = 10.21%) by AAA at 0.2 cm depth. The differences between AAA and PBC at all depths were statistically significant (p < 0.05) in high-dose buildup region, whereas it is not statistically significant in low-dose buildup region. In conclusion, AAA calculated the dose more accurately than PBC in clinically important high-dose buildup region at 0.4 cm and 0.6 cm depths. The use of an orfit cast increases the dose buildup effect, and this buildup effect decreases with depth.
Figures
Similar articles
-
Dosimetric evaluation of the Acuros XB algorithm for a 4 MV photon beam in head and neck intensity-modulated radiation therapy.J Appl Clin Med Phys. 2015 Jul 8;16(4):52–64. doi: 10.1120/jacmp.v16i4.5222. J Appl Clin Med Phys. 2015. PMID: 26218997 Free PMC article.
-
AAA and PBC calculation accuracy in the surface build-up region in tangential beam treatments. Phantom and breast case study with the Monte Carlo code PENELOPE.Radiother Oncol. 2009 Oct;93(1):94-101. doi: 10.1016/j.radonc.2009.05.010. Epub 2009 Jun 21. Radiother Oncol. 2009. PMID: 19541380
-
Experimental verification of the Acuros XB and AAA dose calculation adjacent to heterogeneous media for IMRT and RapidArc of nasopharygeal carcinoma.Med Phys. 2013 Mar;40(3):031714. doi: 10.1118/1.4792308. Med Phys. 2013. PMID: 23464309
-
The accuracy of dose calculations by anisotropic analytical algorithms for stereotactic radiotherapy in nasopharyngeal carcinoma.Phys Med Biol. 2011 Jan 21;56(2):397-413. doi: 10.1088/0031-9155/56/2/008. Epub 2010 Dec 22. Phys Med Biol. 2011. PMID: 21178236
-
High-density dental implants and radiotherapy planning: evaluation of effects on dose distribution using pencil beam convolution algorithm and Monte Carlo method.J Appl Clin Med Phys. 2015 Sep 8;16(5):46–52. doi: 10.1120/jacmp.v16i5.5612. J Appl Clin Med Phys. 2015. PMID: 26699323 Free PMC article. Review.
Cited by
-
Assessment of the accuracy of dose calculation in the build-up region of the tangential field of the breast for a radiotherapy treatment planning system.Contemp Oncol (Pozn). 2017;21(3):232-239. doi: 10.5114/wo.2017.70114. Epub 2017 Sep 29. Contemp Oncol (Pozn). 2017. PMID: 29180932 Free PMC article.
-
A simple method to account for skin dose enhancement during treatment planning of VMAT treatments of patients in contact with immobilization equipment.J Appl Clin Med Phys. 2018 Jul;19(4):239-245. doi: 10.1002/acm2.12394. Epub 2018 Jun 22. J Appl Clin Med Phys. 2018. PMID: 29934993 Free PMC article.
-
The effects of the orthopedic metal artifact reduction (O-MAR) algorithm on contouring and dosimetry of head and neck radiotherapy patients.Med Dosim. 2020 Spring;45(1):92-96. doi: 10.1016/j.meddos.2019.07.003. Epub 2019 Jul 30. Med Dosim. 2020. PMID: 31375297 Free PMC article.
-
A simple technique to improve calculated skin dose accuracy in a commercial treatment planning system.J Appl Clin Med Phys. 2018 Mar;19(2):191-197. doi: 10.1002/acm2.12275. Epub 2018 Feb 6. J Appl Clin Med Phys. 2018. PMID: 29411506 Free PMC article.
-
Dose distribution comparison in volumetric-modulated arc therapy plans for head and neck cancers with and without an external body contour extended technique.Rep Pract Oncol Radiother. 2019 Nov-Dec;24(6):576-584. doi: 10.1016/j.rpor.2019.09.003. Epub 2019 Nov 2. Rep Pract Oncol Radiother. 2019. PMID: 31719798 Free PMC article.
References
-
- Sjögren R, Karlsson M. Electron contamination in clinical high energy photon beams. Med Phys. 1996;23(11):1873–81. - PubMed
-
- Hounsell AR, Wilkinson JM. Electron contamination and build‐up doses in conformal radiotherapy fields. Phys Med Biol. 1999;44(1):43–55. - PubMed
-
- Yang J, Li JS, Qin L, Xiong W, Ma CM. Modeling of electron contamination in clinical photon beams for Monte Carlo dose calculation. Phys Med Biol. 2004;49(12):2657–73. - PubMed
-
- Zhu TC, Palta JR. Electron contamination in 8 and 18 MV photon beams. Med Phys. 1998;25(1):12–19. - PubMed
-
- Lee CH, Chan KK. Electron contamination from the lead cutout used in kilovoltage radiotherapy. Phys Med Biol. 2000;45(1):1–8. - PubMed
MeSH terms
LinkOut - more resources
Full Text Sources
Miscellaneous
