. 2010 Nov 15;35(22):3751-3.
doi: 10.1364/OL.35.003751.

Utility of biodegradable plasmonic nanoclusters in photoacoustic imaging

Affiliations

Utility of biodegradable plasmonic nanoclusters in photoacoustic imaging

Soon Joon Yoon et al. Opt Lett. .

Abstract

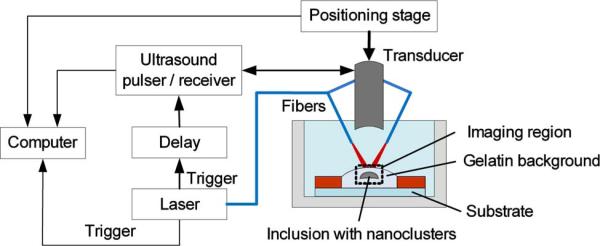
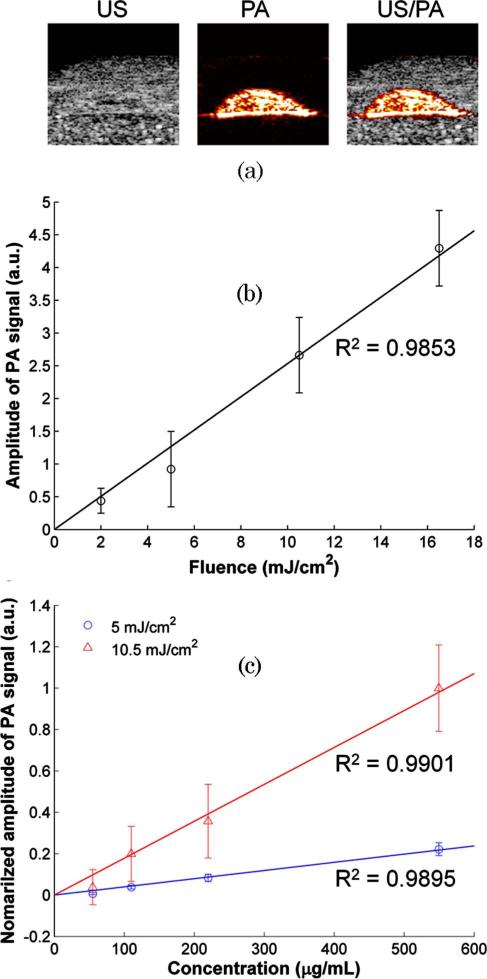
Plasmonic metal nanoparticles are used in photoacoustic imaging as contrast agents because of their resonant optical absorption properties in the visible and near-IR regions. However, the nanoparticles could accumulate and result in long-term toxicity in vivo, because they are generally not biodegradable. Recently, biodegradable plasmonic gold nanoclusters, consisting of sub-5 nm primary gold nanoparticles and biodegradable polymer stabilizer, were introduced. In this Letter, we demonstrate the feasibility of biodegradable nanoclusters as a photoacoustic contrast agent. We performed photoacoustic and ultrasound imaging of a tissue-mimicking phantom with inclusions containing nanoclusters at various concentrations. The results indicate that the biodegradable gold nanoclusters can be used as effective contrast agents in photoacoustic imaging.


Figures

Fig. 1
Fig. 1
(Color online) Diagram of degradation of gold nanoclusters at different pH levels.
Fig. 2
Fig. 2
(Color online) (a) Normalized absorbance spectra and (b) TEM image of biodegradable nanoclusters.
Fig. 3
Fig. 3
(Color online) Block diagram of combined ultrasound and photoacoustic (US/PA) imaging system and the gelatin-based tissue-mimicking phantom with biodegradable nanoclusters inclusion.
Fig 4
Fig 4
(Color online) (a) US, PA, and combined US/PA images of the phantom with inclusion containing nanoclusters. The concentration of the nanoclusters was 550 μg/mL. (b) Photoacoustic signal amplitude with respect to fluence rate and (c) dependence of PA signal on nanocluster concentration at 5 and 10:5 mJ/cm2. The solid lines represent the linear regression fit of the data.

References

    1. Alivisatos P. Nat. Biotechnol. 2003;22:47. - PubMed
    1. Chen Y-S, Frey W, Kim S, Homan K, Kruizinga P, Sokolov K, Emelianov S. Opt. Express. 2010;18:8867. - PMC - PubMed
    1. Homan K, Kim S, Chen Y-S, Wang B, Mallidi S, Emelianov S. Opt. Lett. 2010;35:2663. - PMC - PubMed
    1. Mallidi S, Larson T, Aaron J, Sokolov K, Emelianov S. Opt. Express. 2007;15:6583. - PubMed
    1. Wang B, Yantsen E, Larson T, Karpiouk AB, Sethuraman S, Su JL, Sokolov K, Emelianov SY. Nano Lett. 2009;9:2212. - PubMed

Publication types