

Disturbed expression of splicing factors in renal cancer affects alternative splicing of apoptosis regulators, oncogenes, and tumor suppressors
- PMID: 21082031
- PMCID: PMC2972751
- DOI: 10.1371/journal.pone.0013690
Disturbed expression of splicing factors in renal cancer affects alternative splicing of apoptosis regulators, oncogenes, and tumor suppressors
Abstract
Background: Clear cell renal cell carcinoma (ccRCC) is the most common type of renal cancer. One of the processes disturbed in this cancer type is alternative splicing, although phenomena underlying these disturbances remain unknown. Alternative splicing consists of selective removal of introns and joining of residual exons of the primary transcript, to produce mRNA molecules of different sequence. Splicing aberrations may lead to tumoral transformation due to synthesis of impaired splice variants with oncogenic potential. In this paper we hypothesized that disturbed alternative splicing in ccRCC may result from improper expression of splicing factors, mediators of splicing reactions.
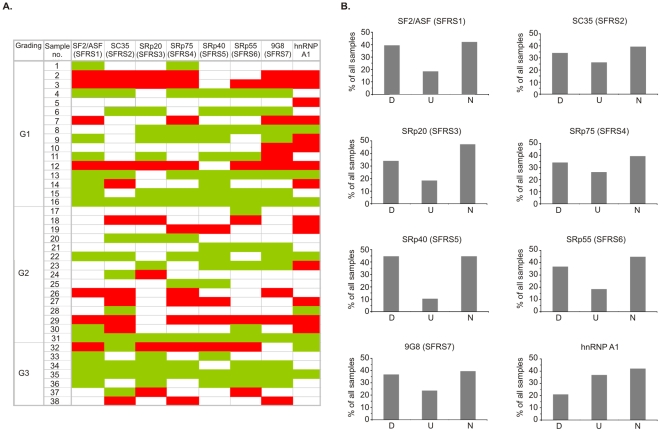
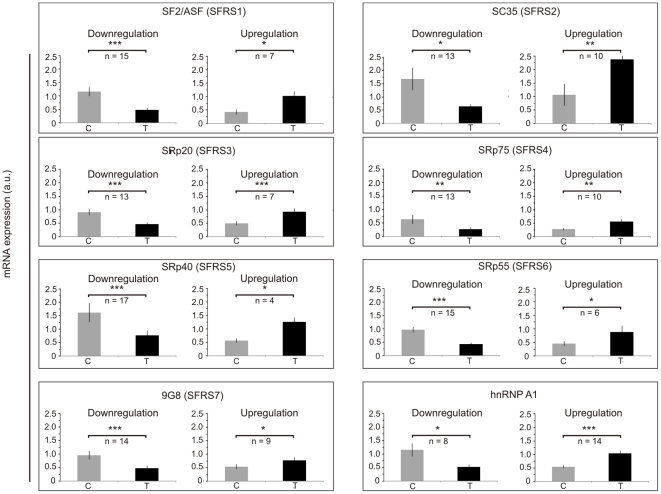
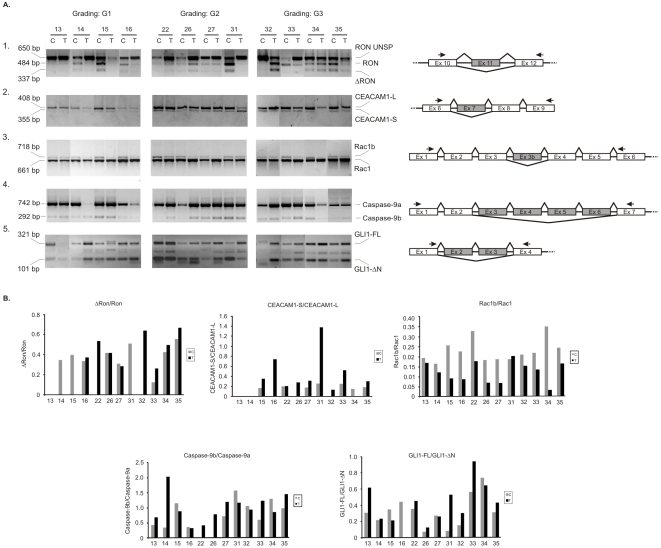
Methodology/principal findings: Using real-time PCR and Western-blot analysis we analyzed expression of seven splicing factors belonging to SR proteins family (SF2/ASF, SC35, SRp20, SRp75, SRp40, SRp55 and 9G8), and one non-SR factor, hnRNP A1 (heterogeneous nuclear ribonucleoprotein A1) in 38 pairs of tumor-control ccRCC samples. Moreover, we analyzed splicing patterns of five genes involved in carcinogenesis and partially regulated by analyzed splicing factors: RON, CEACAM1, Rac1, Caspase-9, and GLI1.
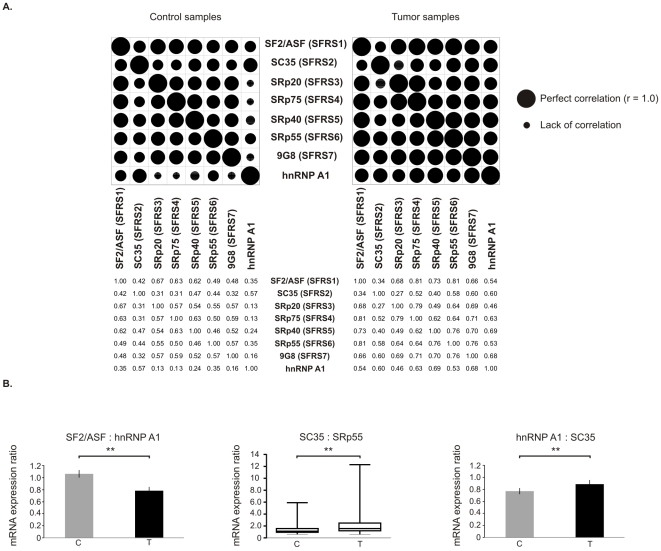
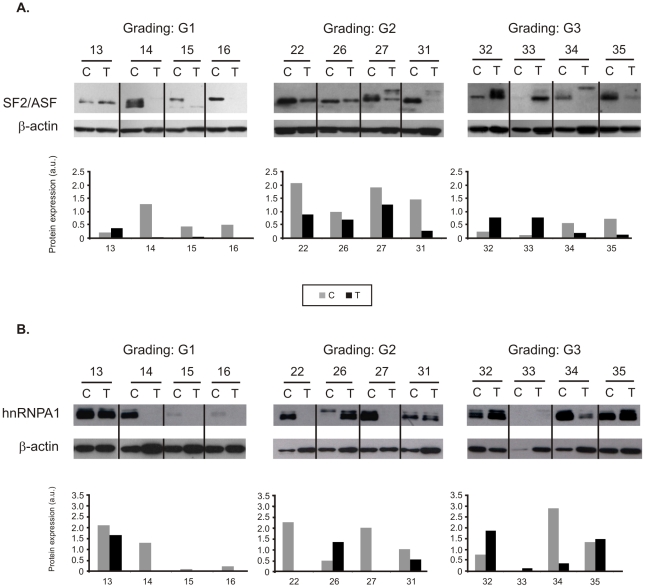
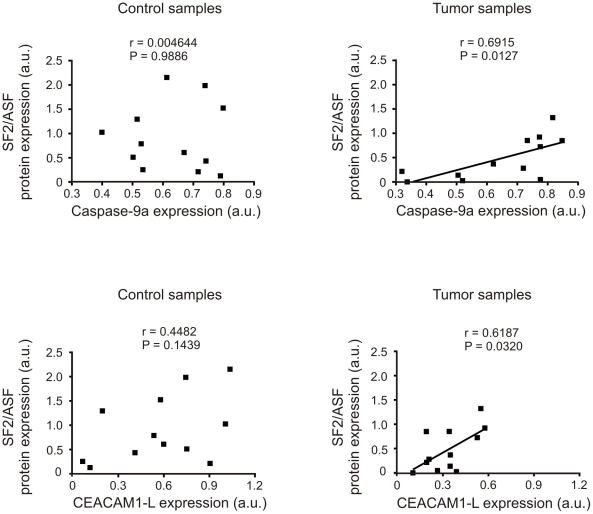
Conclusions/significance: We found that the mRNA expression of splicing factors was disturbed in tumors when compared to paired controls, similarly as levels of SF2/ASF and hnRNP A1 proteins. The correlation coefficients between expression levels of specific splicing factors were increased in tumor samples. Moreover, alternative splicing of five analyzed genes was also disturbed in ccRCC samples and splicing pattern of two of them, Caspase-9 and CEACAM1 correlated with expression of SF2/ASF in tumors. We conclude that disturbed expression of splicing factors in ccRCC may possibly lead to impaired alternative splicing of genes regulating tumor growth and this way contribute to the process of carcinogenesis.
Conflict of interest statement
Figures
Similar articles
-
HnRNP A1 - mediated alternative splicing of CCDC50 contributes to cancer progression of clear cell renal cell carcinoma via ZNF395.J Exp Clin Cancer Res. 2020 Jun 19;39(1):116. doi: 10.1186/s13046-020-01606-x. J Exp Clin Cancer Res. 2020. Retraction in: J Exp Clin Cancer Res. 2023 Feb 8;42(1):43. doi: 10.1186/s13046-023-02613-4. PMID: 32560659 Free PMC article. Retracted.
-
hnRNP A1 and the SR proteins ASF/SF2 and SC35 have antagonistic functions in splicing of beta-tropomyosin exon 6B.J Biol Chem. 2004 Sep 10;279(37):38249-59. doi: 10.1074/jbc.M405377200. Epub 2004 Jun 18. J Biol Chem. 2004. PMID: 15208309
-
Aberrant expression of splicing factors in newly diagnosed acute myeloid leukemia.Onkologie. 2012;35(6):335-40. doi: 10.1159/000338941. Epub 2012 May 22. Onkologie. 2012. PMID: 22722453
-
Splicing factors of SR and hnRNP families as regulators of apoptosis in cancer.Cancer Lett. 2017 Jun 28;396:53-65. doi: 10.1016/j.canlet.2017.03.013. Epub 2017 Mar 14. Cancer Lett. 2017. PMID: 28315432 Review.
-
How Driver Oncogenes Shape and Are Shaped by Alternative Splicing Mechanisms in Tumors.Cancers (Basel). 2023 May 26;15(11):2918. doi: 10.3390/cancers15112918. Cancers (Basel). 2023. PMID: 37296881 Free PMC article. Review.
Cited by
-
Decreased Expression of SRSF2 Splicing Factor Inhibits Apoptotic Pathways in Renal Cancer.Int J Mol Sci. 2016 Sep 28;17(10):1598. doi: 10.3390/ijms17101598. Int J Mol Sci. 2016. PMID: 27690003 Free PMC article.
-
Splicing factor SRSF3 represses the translation of programmed cell death 4 mRNA by associating with the 5'-UTR region.Cell Death Differ. 2014 Mar;21(3):481-90. doi: 10.1038/cdd.2013.171. Epub 2013 Nov 29. Cell Death Differ. 2014. PMID: 24292556 Free PMC article.
-
SRSF2 promotes splicing and transcription of exon 11 included isoform in Ron proto-oncogene.Biochim Biophys Acta. 2014 Nov;1839(11):1132-40. doi: 10.1016/j.bbagrm.2014.09.003. Epub 2014 Sep 8. Biochim Biophys Acta. 2014. PMID: 25220236 Free PMC article.
-
Alternative-splicing defects in cancer: Splicing regulators and their downstream targets, guiding the way to novel cancer therapeutics.Wiley Interdiscip Rev RNA. 2018 Jul;9(4):e1476. doi: 10.1002/wrna.1476. Epub 2018 Apr 25. Wiley Interdiscip Rev RNA. 2018. PMID: 29693319 Free PMC article. Review.
-
Revealing the Determinants of Widespread Alternative Splicing Perturbation in Cancer.Cell Rep. 2017 Oct 17;21(3):798-812. doi: 10.1016/j.celrep.2017.09.071. Cell Rep. 2017. PMID: 29045845 Free PMC article.
References
-
- Schöffski P, Dumez H, Clement P, Hoeben A, Prenen H, et al. Emerging role of tyrosine kinase inhibitors in the treatment of advanced renal cell cancer: a review. Ann Oncol. 2006;17:1185–1196. - PubMed
-
- Ljungberg B, Hanbury DC, Kuczyk MA, Merseburger AS, Mulders PFA, et al. on behalf of the European Association of Urology (EAU) 2009. Guidelines on renal cell carcinoma. Available on the website of the European Association of Urology (accessed 2010) http://www.uroweb.org/fileadmin/tx_eauguidelines/2009/Full/RCC.pdf.
-
- Piekielko-Witkowska A, Master A, Wojcicka A, Boguslawska J, Brozda I, et al. Disturbed expression of type 1 iodothyronine deiodinase splice variants in human renal cancer. Thyroid. 2009;19:1105–1113. - PubMed
-
- Gereben B, Bianco AC. Covering the base-pairs in iodothyronine deiodinase-1 biology: holes remain in the lineup. Thyroid. 2009;19:1027–1029. - PubMed
Publication types
MeSH terms
LinkOut - more resources
Full Text Sources
Other Literature Sources
Medical
Research Materials
Miscellaneous
