. 2011:686:193-212.
doi: 10.1007/978-1-60761-938-3_8.

Multiparametric magnetic resonance imaging and repeated measurements of blood-brain barrier permeability to contrast agents

Affiliations

Multiparametric magnetic resonance imaging and repeated measurements of blood-brain barrier permeability to contrast agents

Tavarekere N Nagaraja et al. Methods Mol Biol. 2011.

Abstract

Breakdown of the blood-brain barrier (BBB) is present in several neurological disorders such as stroke, brain tumors, and multiple sclerosis. Noninvasive evaluation of BBB breakdown is important for monitoring disease progression and evaluating therapeutic efficacy in such disorders. One of the few techniques available for noninvasively and repeatedly localizing and quantifying BBB damage is magnetic resonance imaging (MRI). This usually involves the intravenous administration of a gadolinium-containing MR contrast agent (MRCA) such as Gadolinium-diethylenetriaminepentaacetic acid (Gd-DTPA), followed by dynamic contrast-enhanced MR imaging (DCE-MRI) of brain and blood, and analysis of the resultant data to derive indices of blood-to-brain transfer. There are two advantages to this approach. First, measurements can be made repeatedly in the same animal; for instance, they can be made before drug treatment and then again after treatment to assess efficacy. Secondly, MRI studies can be multiparametric. That is, MRI can be used to assess not only a blood-to-brain transfer or influx rate constant (Ki or K1) by DCE-MRI but also complementary parameters such as: (1) cerebral blood flow (CBF), done in our hands by arterial spin-tagging (AST) methods; (2) magnetization transfer (MT) parameters, most notably T1sat, which appear to reflect brain water-protein interactions plus BBB and tissue dysfunction; (3) the apparent diffusion coefficient of water (ADCw) and/or diffusion tensor, which is a function of the size and tortuosity of the extracellular space; and (4) the transverse relaxation time by T2-weighted imaging, which demarcates areas of tissue abnormality in many cases. The accuracy and reliability of two of these multiparametric MRI measures, CBF by AST and DCE-MRI determined influx of Gd-DTPA, have been established by nearly congruent quantitative autoradiographic (QAR) studies with appropriate radiotracers. In addition, some of their linkages to local pathology have been shown via corresponding light microscopy and fluorescence imaging. This chapter describes: (1) multiparametric MRI techniques with emphasis on DCE-MRI and AST-MRI; (2) the measurement of the blood-to-brain influx rate constant and CBF; and (3) the role of each in determining BBB permeability.


Figures
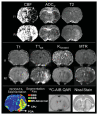
Figure 1
Figure 1
A representative data set showing multiparametric MRI-derived maps obtained before (I1t) and after reperfusion (R1t) from an animal subjected to 3 h of transient focal ischemia. Top (left to right): cerebral blood flow (CBF), apparent diffusion coefficient (ADCw) and transverse relaxation time (T2) maps. Middle (left to right): spin–lattice relaxation times in the absence and presence of off-resonance saturation (T1 and T1sat, respectively), the forward rate of magnetization transfer (Kfor), and magnetization transfer ratio (MTR) maps. Bottom row: A corresponding ISODATA segmentation theme map to demonstrate the ROIs that were selected to represent ischemic tissue with (red and green) and without (yellow) BBB disruption (left). To the right, are a corresponding 14C-AIB autoradiographic image and a cresyl violet stained histologic section that were used to confirm acute BBB damage and the region of ischemic damage, respectively. (From Knight et al. Magn Reson Med. 2005;54:822-832)
Figure 2
Figure 2
Representative Patlak plots of the ratio of brain tissue (Ctis) concentrations of Gd-DTPA to plasma [Cpa=Ca(t)/(1-Hct)] vs. concentration ratio-stretched time (tstretch) for three brain regions of interest (ROI) from one rat. The Gd-DTPA Ki values were obtained from the slope of the lines. Among the regions with leaky capillaries, the influx appeared to be greater in the preoptic area (PoA) than the striatum. The slopes in these two regions were significantly different from zero and indicate an appreciable, but small, Gd-DTPA influx. The slope of the line was flat (and statistically not different than zero) for the contralateral ROI and indicates a normal Ki. The units on the abscissa are plasma concentration ratio-stretched time, not real time (which was about 24 min in this case). (From Knight et al. Magn Reson Med. 2005;54:813-821)
Figure 3
Figure 3
Vascular parameters pre- (left, test) and post-dexamethasone (right, re-test) administration. A: Vascular volume vD, B: Transfer constant K1 [min−1], C: Efflux constant kb [min−1], D: F-test for Model 3 vs Model 2, with a high value resulting in rejection of Model 2. Only those regions in C with high F-test values have valid results for the estimate of kb. A widespread decrease in K1 and kb are easily visualized. Less visible is a moderate decrease in vD. Bright spots in the maps of vD correspond to vascular pools. Note the decrease in the F-test from pre- to post-dexamethasone studies. (From Ewing et al. J Magn Reson Imaging 2008;27:1430-1438)
Figure 4
Figure 4
A representative collage of Gd-DTPA and Gd-BSA-Evans Blue (EB) enhancements during MRI, corresponding T1sat maps and fluorescence images from one experiment. A – Gd-DTPA enhancement in a rat 24 hours after 3 hours of MCA occlusion. A large area of brightness is seen in the preoptic area and striatum. The small, bilateral, bright regions below this enhancement are parts of medium eminence and hence, naturally leaky. Contrast enhancement in such regions, ventricles (large arrows), and pial vasculature surrounding the brain were routinely observed. B – Subsequent Gd-BSA-EB enhancement in this rat. It is a much smaller area. Other normally leaky regions are also visible. In C, the T1sat map for this slice is shown in gray scale. On the calibration bar on the left, hyperintense/bright areas indicate increased values. The ventricles and circumventricular organs appear bright on this map due to the inherent sensitivity of T1sat to water/proton shifts. The low-magnification, reconstructed fluorescence image shown (D) has extravascular red fluorescence in the same regions of interest as the Gd-BSA-EB–enhancing area in B. The greenish-yellow hue in the rest of the vasculature is due to the combination of red (EB) and green (fluorescein isothiocyanate–dextran) fluorescence. This image was constructed by collecting the coronal brain section as a series of low magnification (X2.5) images and tiling them together. (From Nagaraja et al. Stroke. 2008;39:427-432).

Similar articles

Cited by

References

    1. Fenstermacher JD, Nagaraja T, Davies KR. In: Overview of the structure and function of the blood-brain barrier in vivo. Kobiler SL D, Shapira S, editors. Kluwer Academic/Plenum Publishers; New York: 2001. pp. 1–7.
    1. Aronowski J, Strong R, Grotta JC. Reperfusion injury: demonstration of brain damage produced by reperfusion after transient focal ischemia in rats. J Cereb Blood Flow Metab. 1997;17:1048–1056. - PubMed
    1. Knight RA, Barker PB, Fagan SC, Li Y, Jacobs MA, Welch KM. Prediction of impending hemorrhagic transformation in ischemic stroke using magnetic resonance imaging in rats. Stroke. 1998;29:144–151. - PubMed
    1. The NINDS. (The NINDS t-PA Stroke Study Group) Intracerebral hemorrhage after intravenous t-PA therapy for ischemic stroke. Stroke. 1997;28:2109–2118. - PubMed
    1. Albers GW, Thijs VN, Wechsler L, Kemp S, Schlaug G, Skalabrin E, Bammer R, Kakuda W, Lansberg MG, Shuaib A, Coplin W, Hamilton S, Moseley M, Marks MP. Magnetic resonance imaging profiles predict clinical response to early reperfusion: the Diffusion and Perfusion Imaging Evaluation for Understanding Stroke Evolution (DEFUSE) study. Ann Neurol. 2006;60:508–517. - PubMed

Publication types