

Review
doi: 10.1021/cr100182b.
Epub 2010 Nov 17.
Proton-coupled electron flow in protein redox machines
Affiliations
- PMID: 21082865
- PMCID: PMC3005815
- DOI: 10.1021/cr100182b
Item in Clipboard
Review
Proton-coupled electron flow in protein redox machines
Chem Rev.
.
No abstract available
Figures
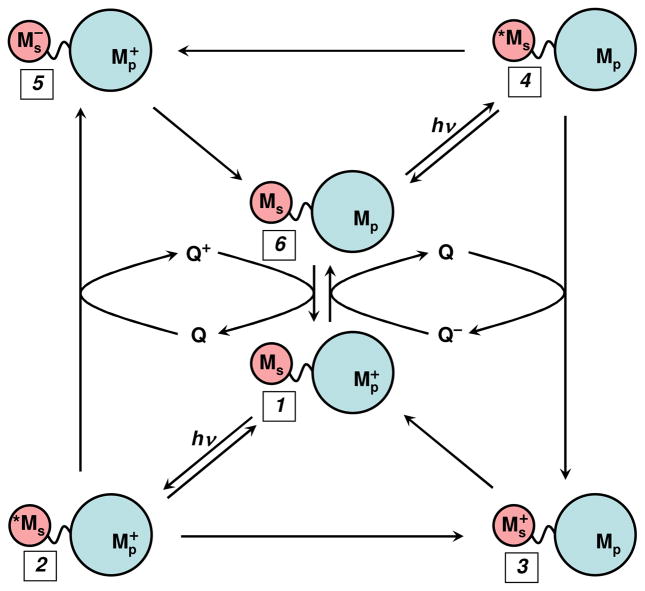
Flash-quench scheme for measuring intraprotein ET rates, and generating oxidized and reduced metal centers in proteins. MS is a metal-diimine photosensitizer; MP is the protein metal center.
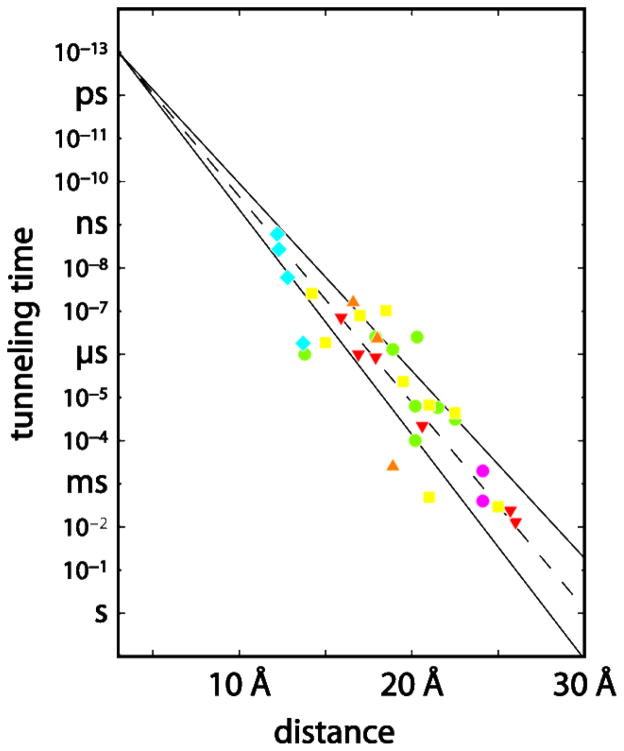
Timetable for driving-force-optimized electron tunneling in RuII-modified proteins: azurin (red); cytochrome c (green); cytochrome b562 (yellow; myoglolbin (orange); high-potential iron protein (cyan); Zn-cytochrome c crystals (magenta). The solid lines illustrate limiting β values of 1.0 and 1.2 Å−1; the dashed line illustrates a 1.1 Å−1 distance decay.
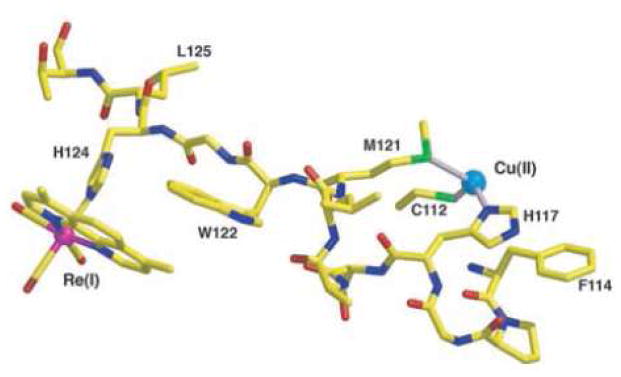
Model of the Cu-W-Re electron-tunneling architecture from the 1.5 Å resolution x-ray crystal structure of Re(His124)+(Trp122)CuII-azurin.. the aromatic rings of the phenanthroline ligand and Trp122 slightly overlap with one methyl group projecting over the indole ring and the plane of the respective π-systems making a 20.9° angle. The average separation of atoms on the overlapped six-membered rings is 3.82 Å, whereas 4.1 Å separates the edge of the Trp122 indole and the His124 imidazole. Distances between redox centers: Cu to Trp122 aromatic centroid, 11.1 Å; Trp122 aromatic centroid to Re, 8.9 Å; Cu to Re, 19.4 Å. Reprinted with permission from Reference . Copyright 2008 American Association for the Advancement of Science.
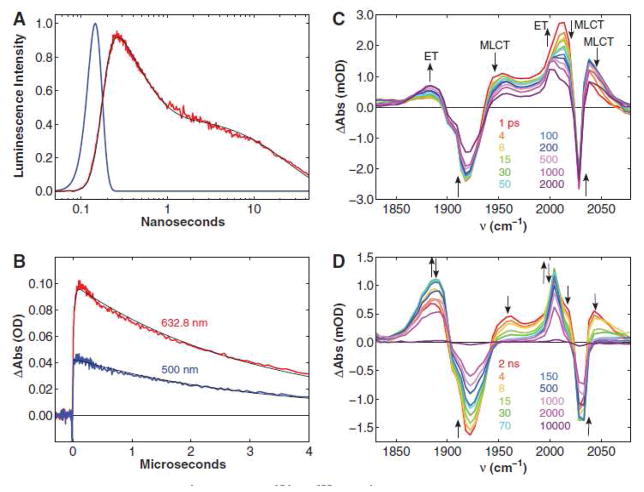
Transient kinetics of Re(His124)+(Trp122)CuI-azurin. (a) Time resolved luminescence (red: λobs > 450 nm; λex = 355 nm, 10 ps pulsewidth; pH 7.2), instrument response function (blue), and fit to a three exponential kinetics model (black: τ1 = 35 ps (growth); τ2 = 363 ps (decay); τ3 = 25 ns (decay)). (b) Visible transient absorption (λobs = 632.8 (red), 500 nm (blue); λex = 355 nm, 1.5 mJ, 8 ns pulsewidth; pH 7.2). Black lines are fits to a biexponential kinetics model (τ1 = 25 ns (growth); τ2 = 3.1 μs (decay)). (c, d) TRIR spectra measured (λex = 400 nm, ~ 150 fs pulsewidth; D2O, pD = 7.0, phosphate buffer) at selected time delays after femtosecond laser excitation. Reprinted with permission from Reference . Copyright 2008 American Association for the Advancement of Science.
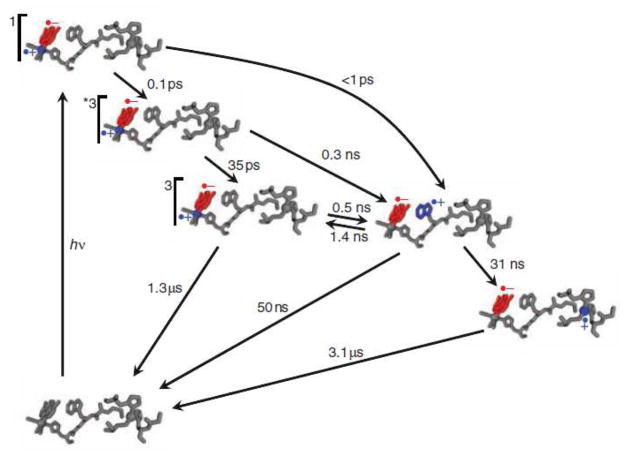
Kinetics model of photoinduced electron transfer in Re(His124)+(Trp122)CuI-azurin. Photoexcitation produces electron (red) and hole (blue) separation in the MLCT-excited ReI complex. Hole transfer to CuI via (Trp122) •+ is complete in less than 50 ns. Charge recombination occurs on the microsecond timescale. Rate constants for elementary steps were obtained from fitting time-resolved luminescence, visible absorption, and infrared spectroscopic data. Reprinted with permission from Reference . Copyright 2008 American Association for the Advancement of Science.
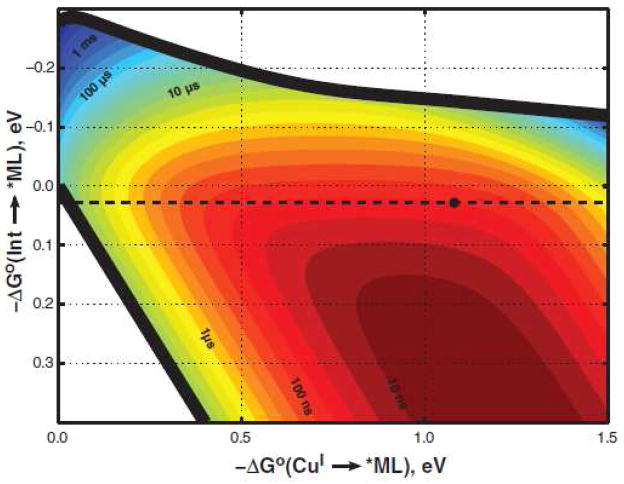
Two-step hopping map for electron tunneling through ReI-modified azurin. Colored contours reflect electron-transport time scales as functions of the driving force for the first tunneling step (ordinate, Int→*ML) and the overall electron-transfer process (abscissa, CuI→*ML). The heavy black lines enclose the region in which two-step hopping is faster than single-step tunneling. The dashed black line indicates the driving force for Re(His124)+*(Trp122)CuI-azurin → Re(His124)0(Trp122) •+CuI-azurin ET; the black dot corresponds to Re(His124)+*(Trp122)CuI-azurin → Re(His124)0(Trp122) •+CuI-azurin→Re(His124)0(Trp122)CuII-azurin hopping. Reprinted with permission from Reference . Copyright 2008 American Association for the Advancement of Science.
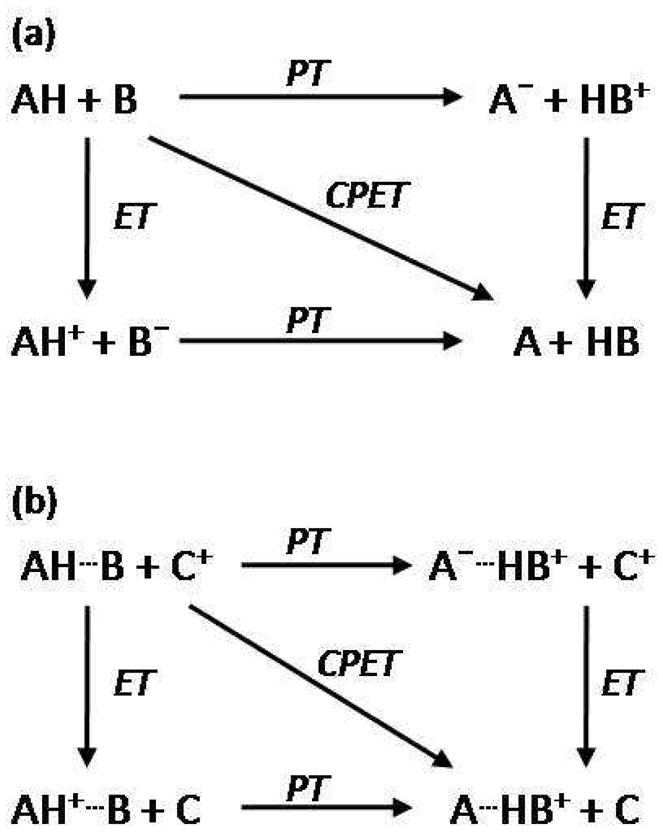
Perimeters of the square illustrate the stepwise, limiting mechanisms of sequential proton and electron transfer steps. The concerted pathway, CPET, is illustrated by the diagonal of the square. (a) Unidirectional or collinear PCET: proton and electron transfer from a single donor along the same direction to a single acceptor. (b) Orthogonal or bidirectional PCET: proton and electron transfer to separate proton and electron acceptors. Adapted from Reference . With kind permission from Springer Science+Business Media: Photosynthesis Research, Models for proton-coupled electron transfer in Photosystem II, 87, 2006, 1, Mayer, J. M.; Rhile, I. J.; Larsen, F. B.; Mader, E. A.; Markle, T. F.; Dipasquale, A. G., Scheme 1.
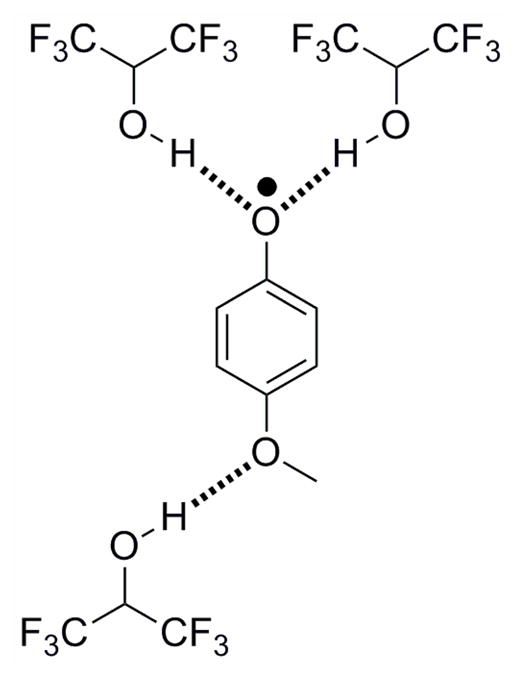
Phenoxyl radicals stabilized via intramolecular hydrogen bonds to hexafluoropropanol. Interactions between substituents and hexafluoropropanol and other hydrogen-bond accepting and donating solvents was shown to affect the stabilization of the phenoxyl radical.
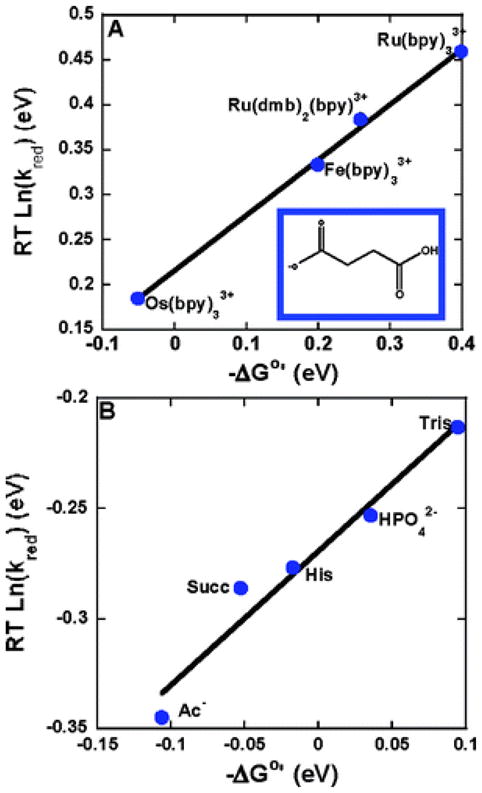
Rates of oxidation (RT lnkred) of tyrosine vs. driving force −ΔG°′ at 298 K. (A) Driving force was varied by utilizing several oxidants (bpy is bipyridine, dmb is 4,4″-dimethyl-2,2′-bipyridine) with different E°′(M3+/2+) with a common base (succinate monoanion) at pH 4.9. (B) Driving force was varied by utilizing several acceptor bases (Ac−: acetate, Succ: succinate monoanion, His: histidine, HPO42−: dibasic phosphate, Tris: tris) with different pKa values with [Os(bpy)3]2+ as the oxidant. 0.050 M buffer solutions with a 10:1 base to acid ratio were utilized. In both figures the slope is 0.61. Reprinted with permission from Reference . Copyright 2007 American Chemical Society.
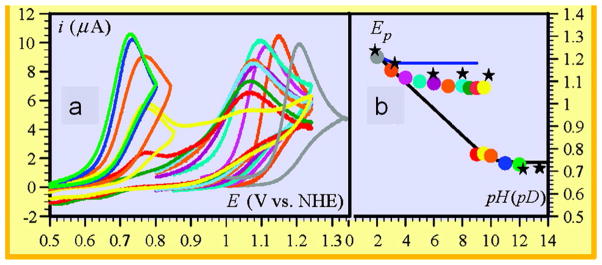
(a) Cyclic voltammetry of phenol in water at 0.2 V/s in unbuffered water. (b) Peak potentials of cyclic voltammetry plotted as a function of pH. The black stars are the peak potentials in D2O. The blue line is the simulated variation of peak potential for a CPET mechanism. The color code of the voltammograms correspond to the color code of the peak potentials. Reprinted with permission from Reference . Copyright 2010 American Chemical Society.
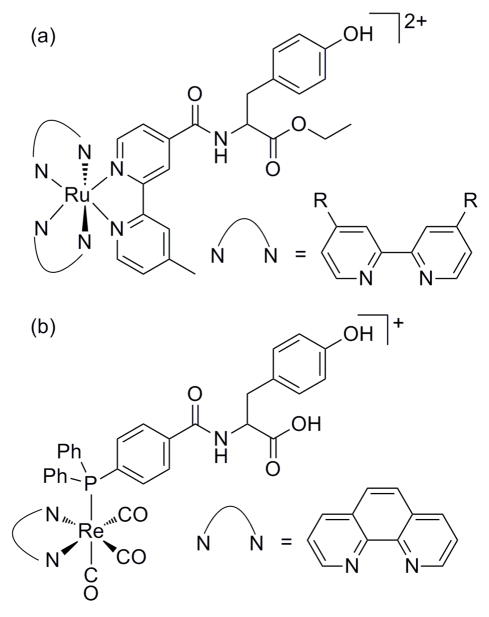
Photosensitizers with appended tyrosine utilized in studies of photochemical oxidation of tyrosine.. (a) RuII-Tyr complexes. R = H or COOEt (b) ReI(P-Y) complex; P-Y is a diphenylphosphinobenzoic acid with an amide linkage to a tyrosine.
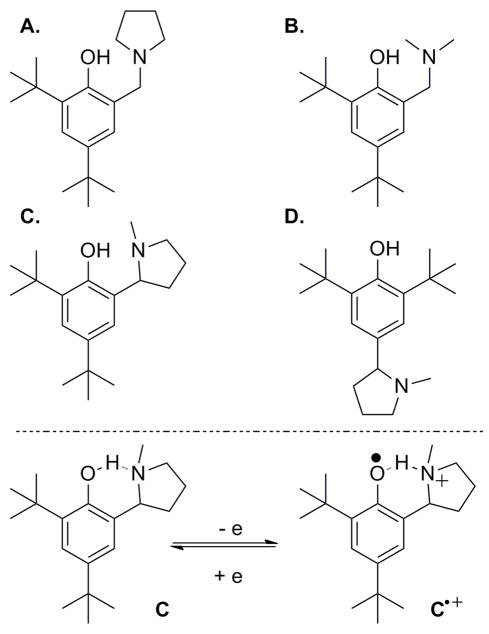
(top) Phenol derivatives A–D with α-alkyl amino groups at the ortho or para positions. (bottom) The proposed reversible redox process of C/C•+ with intramolecular migration of the phenolic proton to the hydrogen-bonded amine.
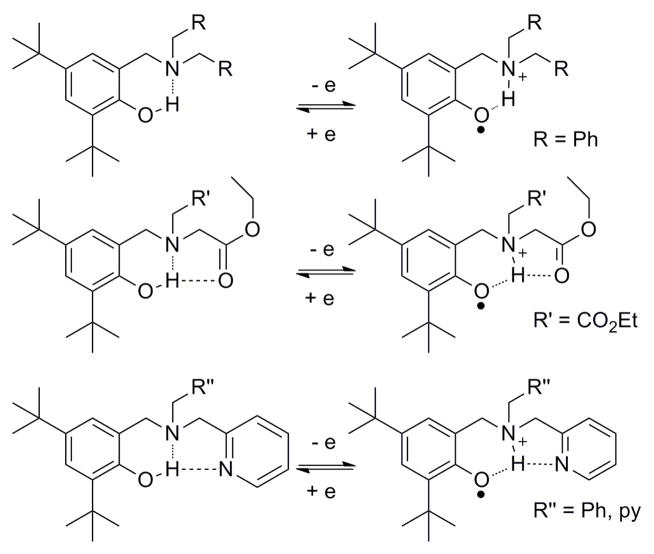
Phenol derivatives with tertiary amines and their corresponding hydrogen-bonded phenoxyl radicals. The multiple hydrogen-bond networks seen in the ester or pyridine substituted pyridines affect the PCET process and the stability of the phenoxyl radical.
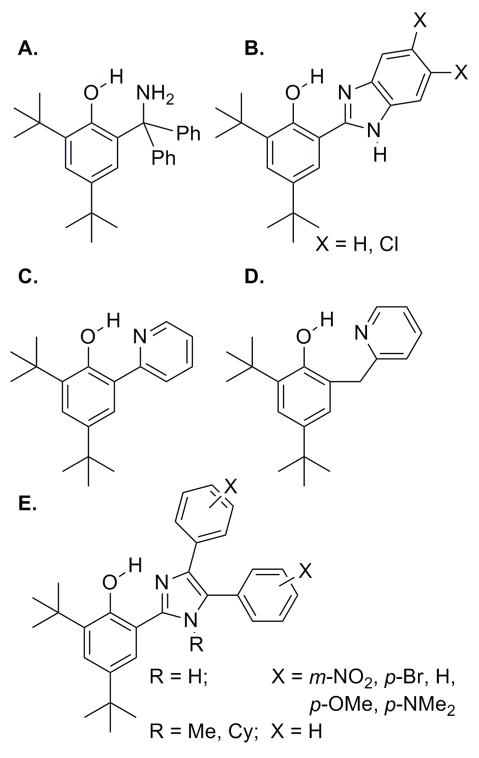
Intramolecular hydrogen bonds between phenols and appended (a) amines, (b, e) imidazoles, and (c, d) pyridines.
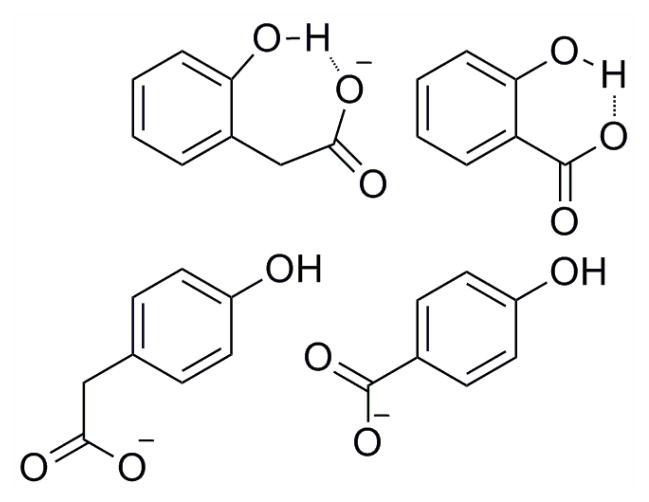
Ortho- and para- carboxylate-substituted phenols with and without intramolecular hydrogen bonds.
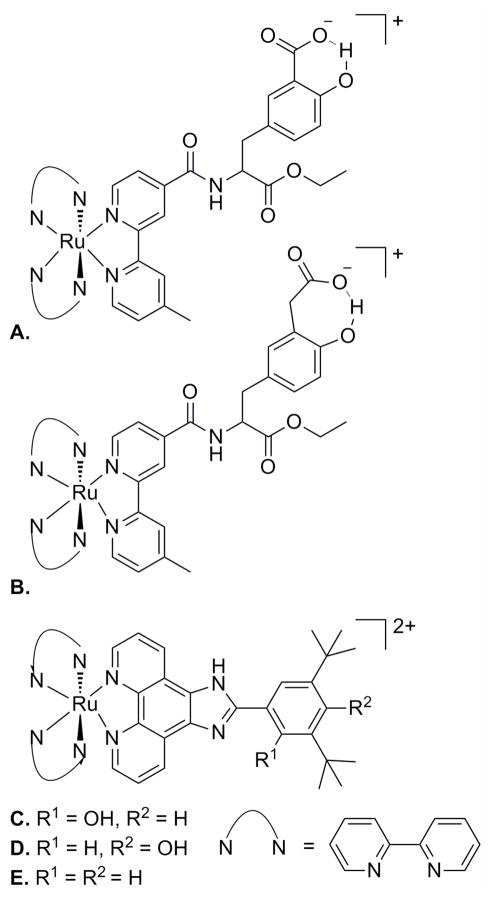
Ruthenium polypyridyl complexes with covalently linked phenols containing intramolecular hydrogen bonds to (a, b) carboxylates and (c) imidazoles and the (d, e) corresponding control complexes.
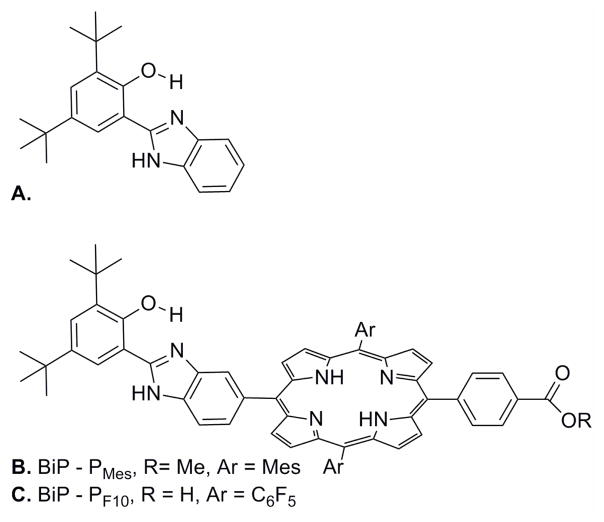
(a) A tyrosine-histidine model complex, BiP, with intermolecular phenol-imidazole hydrogen bonds. (b) BiP-PMes and (c) BiP-PF10, BiP modified porphyrins.
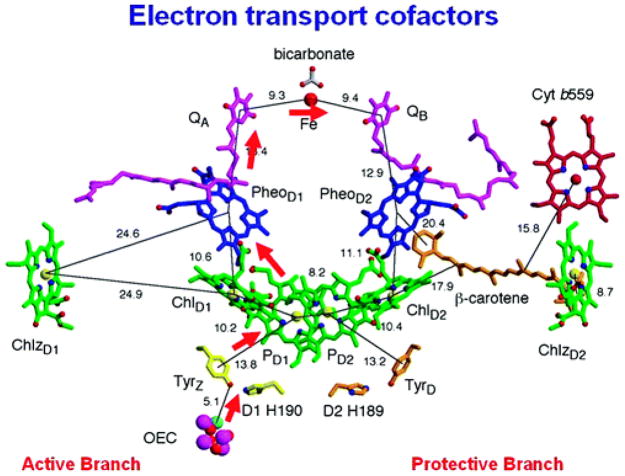
Molecular structure of the cofactors involved in electron transfer in Photosystem-II. Image is visualized perpendicular to the internal pseudo-two-fold axis. The electron transfer pathway is indicated by red arrows, and distances are given in angstroms. Reprinted with permission from Reference . Copyright 2008 American Chemical Society.
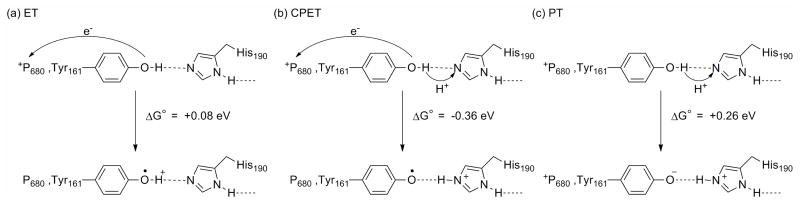
Driving forces for (a) ET, (b) CPET, and (c) PT reactions at TyrZ (Tyr161). Adapted from Reference .
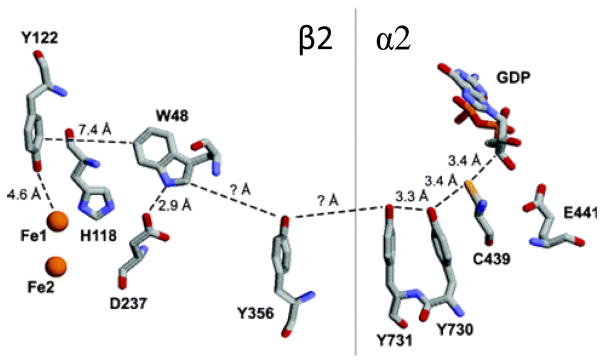
Putative PCET pathway for radical transport from Tyr122• to C439 in E. coli RNR, based on conserved residues, crystal structures of subunits β2 and α2, and a docking model. Tyr356 has not been located in either the β2 or α2 crystal structure; other distances are taken from crystal structures. Reprinted with permission from Reference . Copyright 2006 American Chemical Society.
References
-
- Saraste M. Science. 1999;283:1488. - PubMed
-
- Hinchliffe P, Sazanov LA. Science. 2005;309:771. - PubMed
-
- Sazanov LA, Hinchliffe P. Science. 2006;311:1430. - PubMed
-
- Tsukihara T, Aoyama H, Yamashita E, Tomizaki T, Yamaguchi H, Shinzawaitoh K, Nakashima R, Yaono R, Yoshikawa S. Science. 1995;269:1069. - PubMed
-
- Iwata S, Ostermeier C, Ludwig B, Michel H. Nature. 1995;376:660. - PubMed
Publication types
MeSH terms
Substances
Grants and funding
LinkOut - more resources
Full Text Sources
