

Analytical validation of accelerator mass spectrometry for pharmaceutical development
- PMID: 21083256
- PMCID: PMC3114459
- DOI: 10.4155/bio.10.14
Analytical validation of accelerator mass spectrometry for pharmaceutical development
Abstract
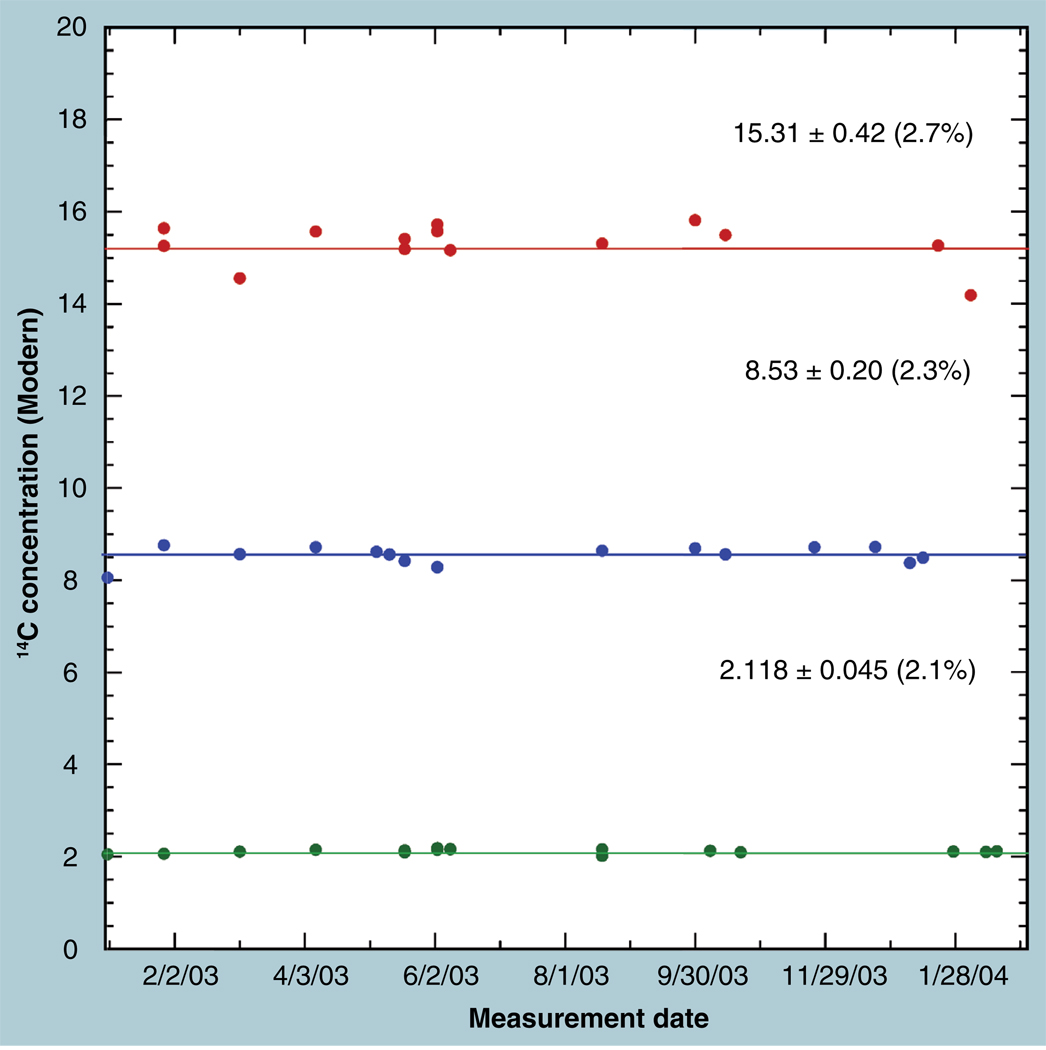
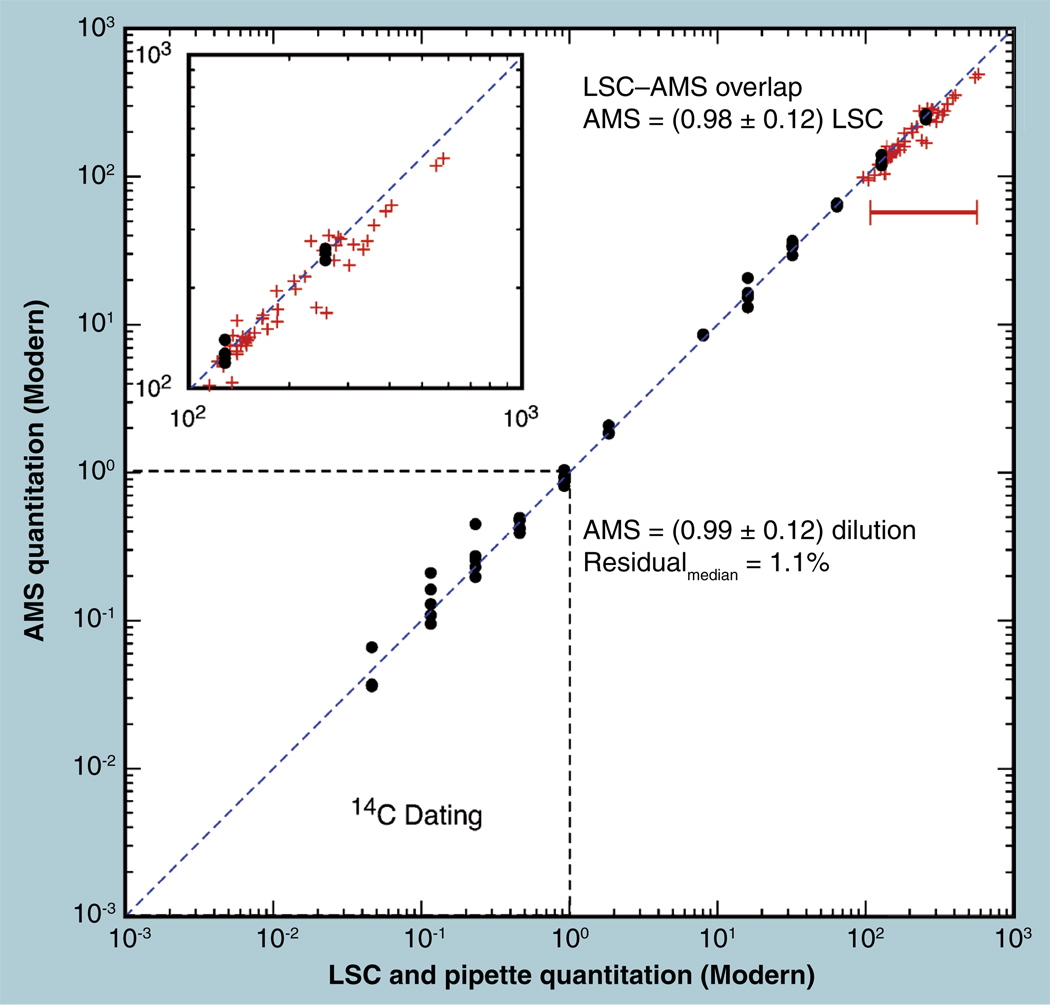
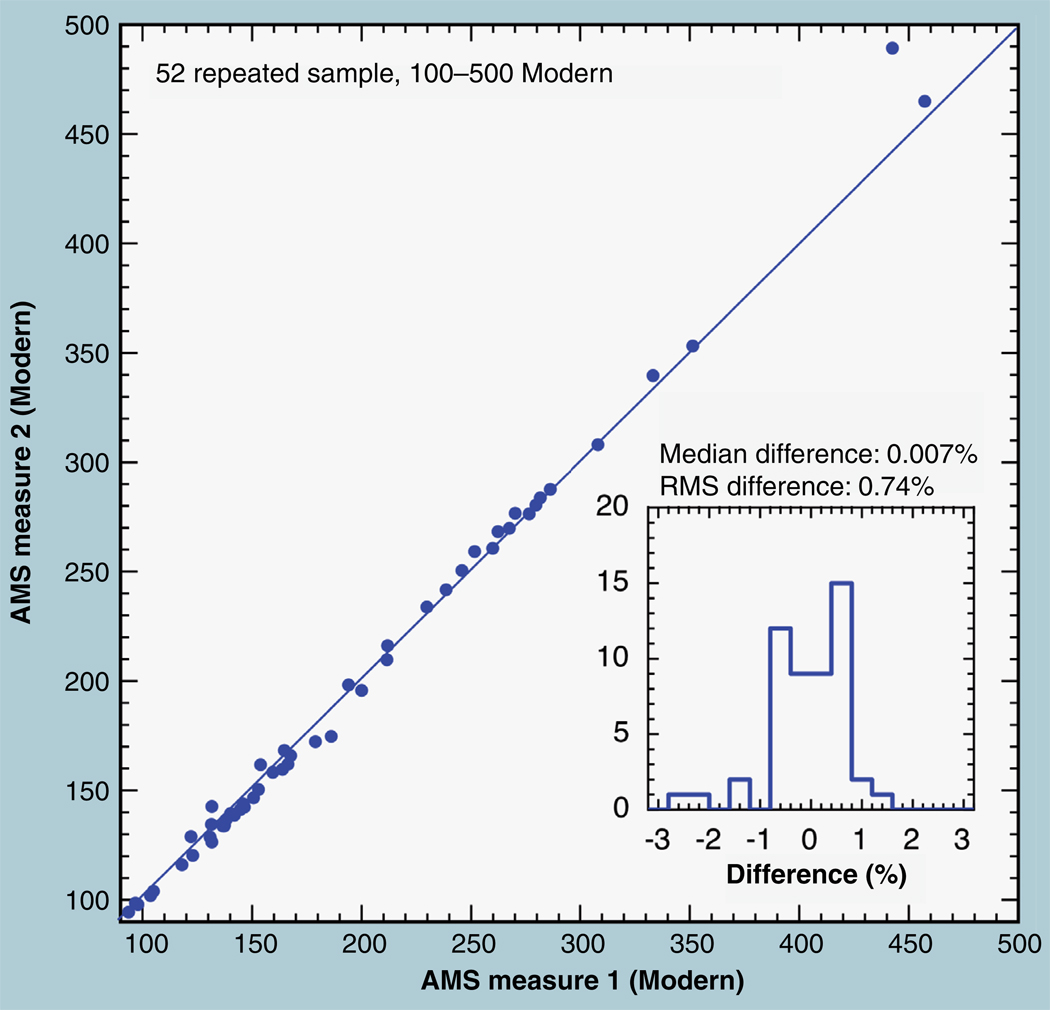
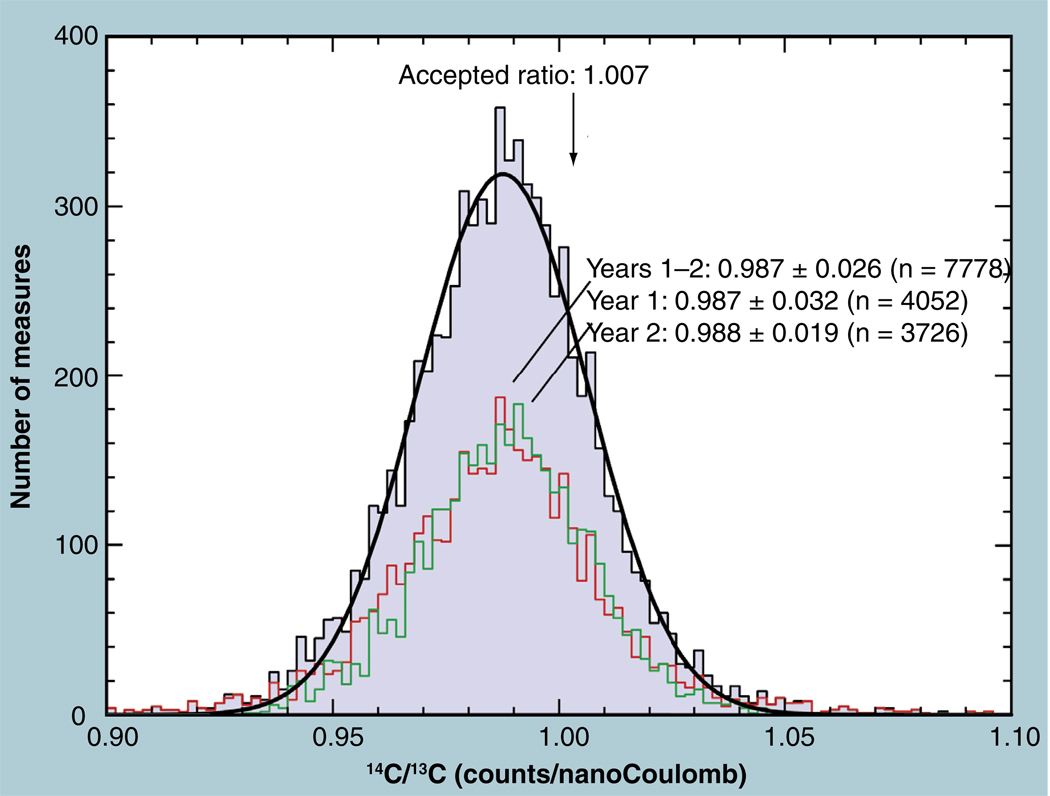
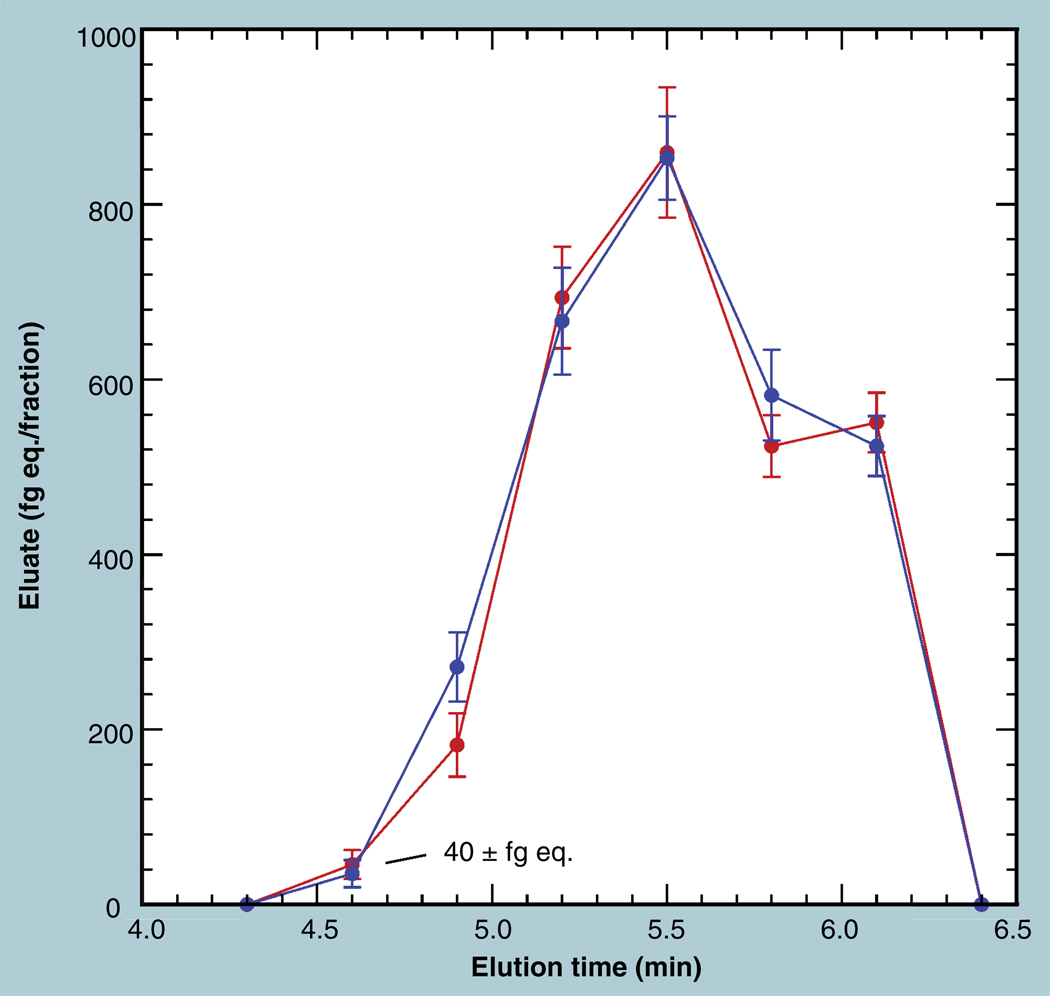
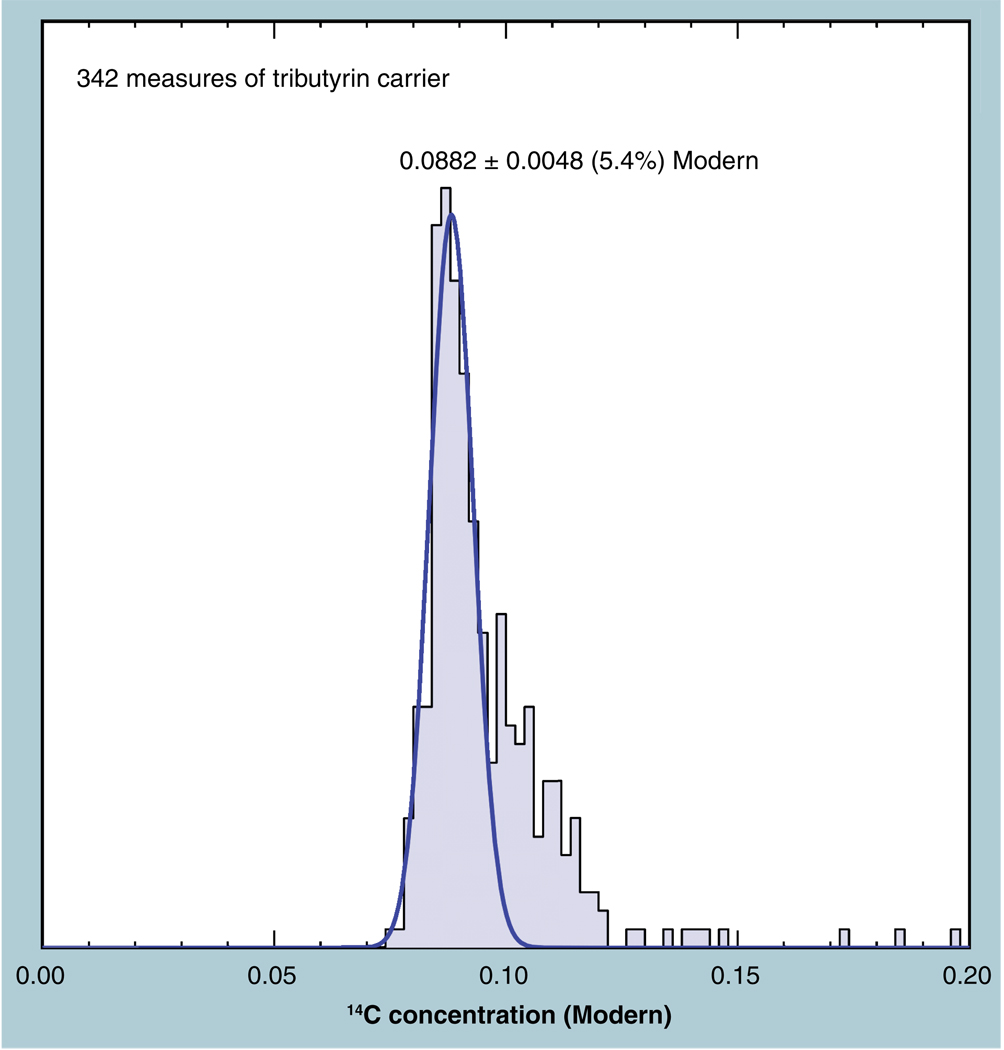
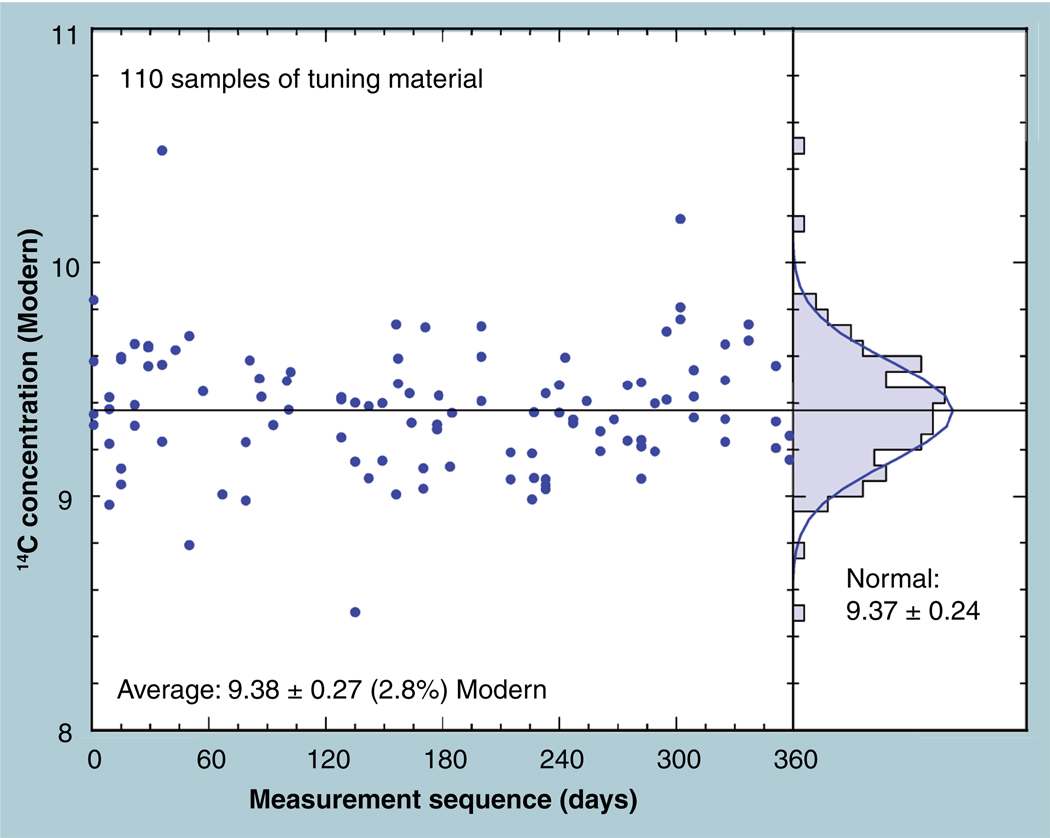
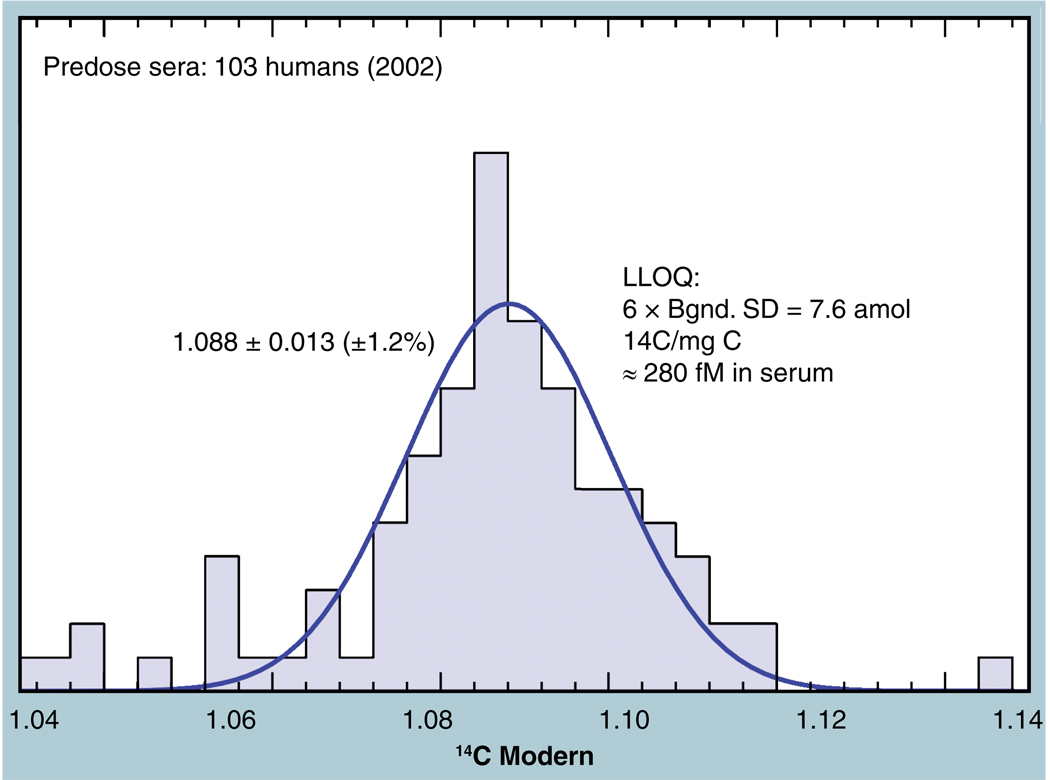
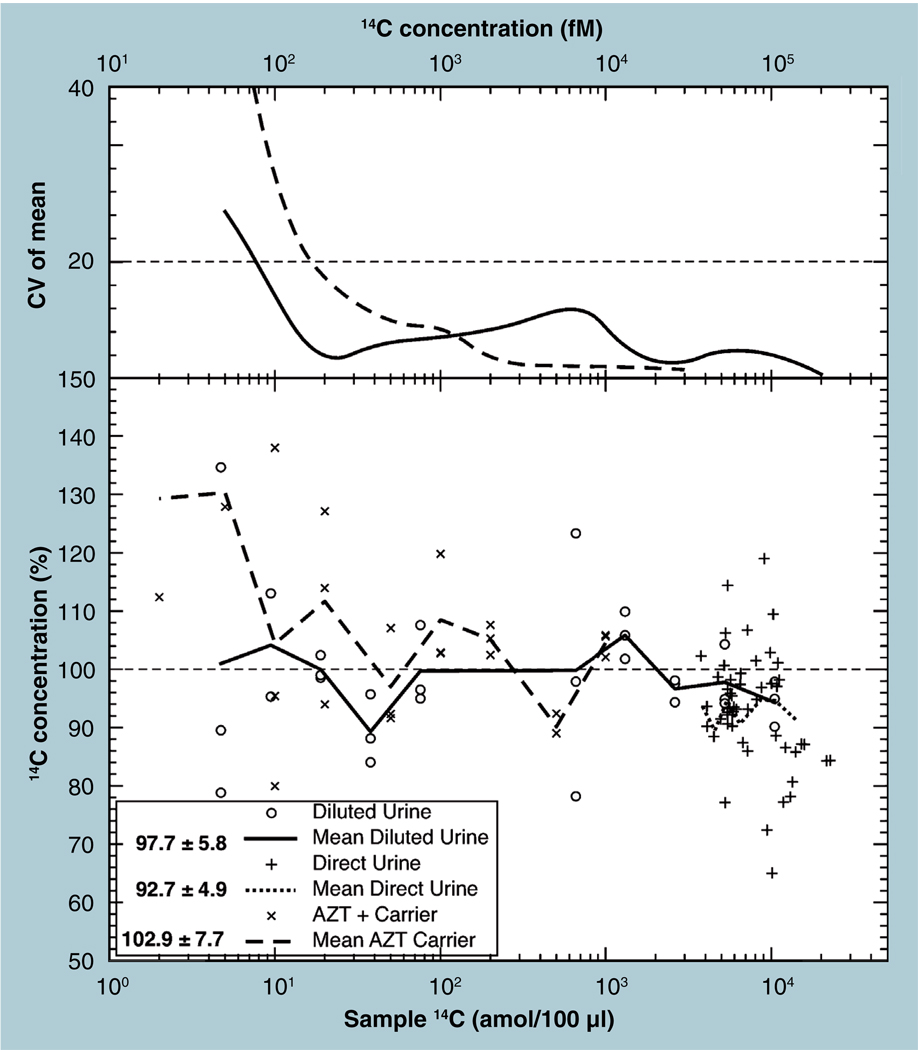
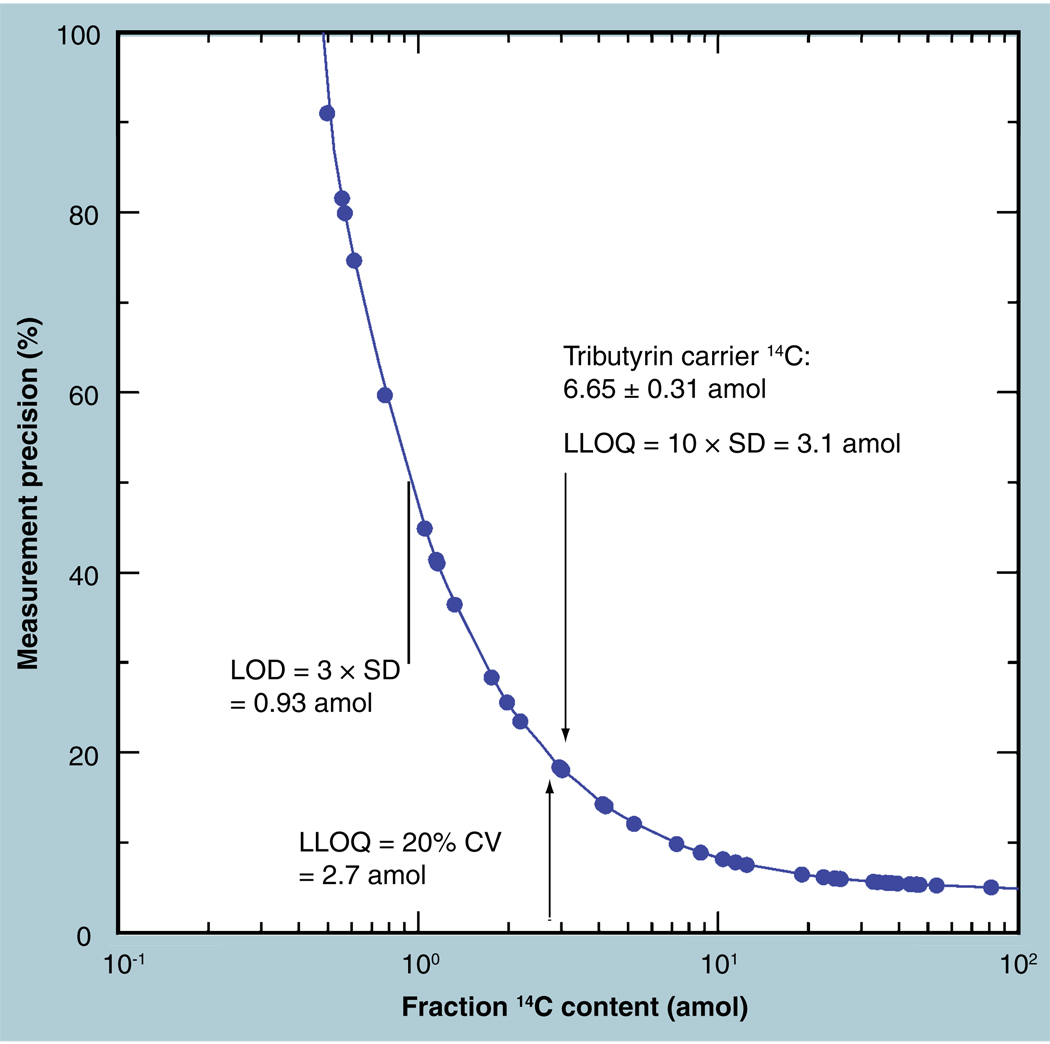
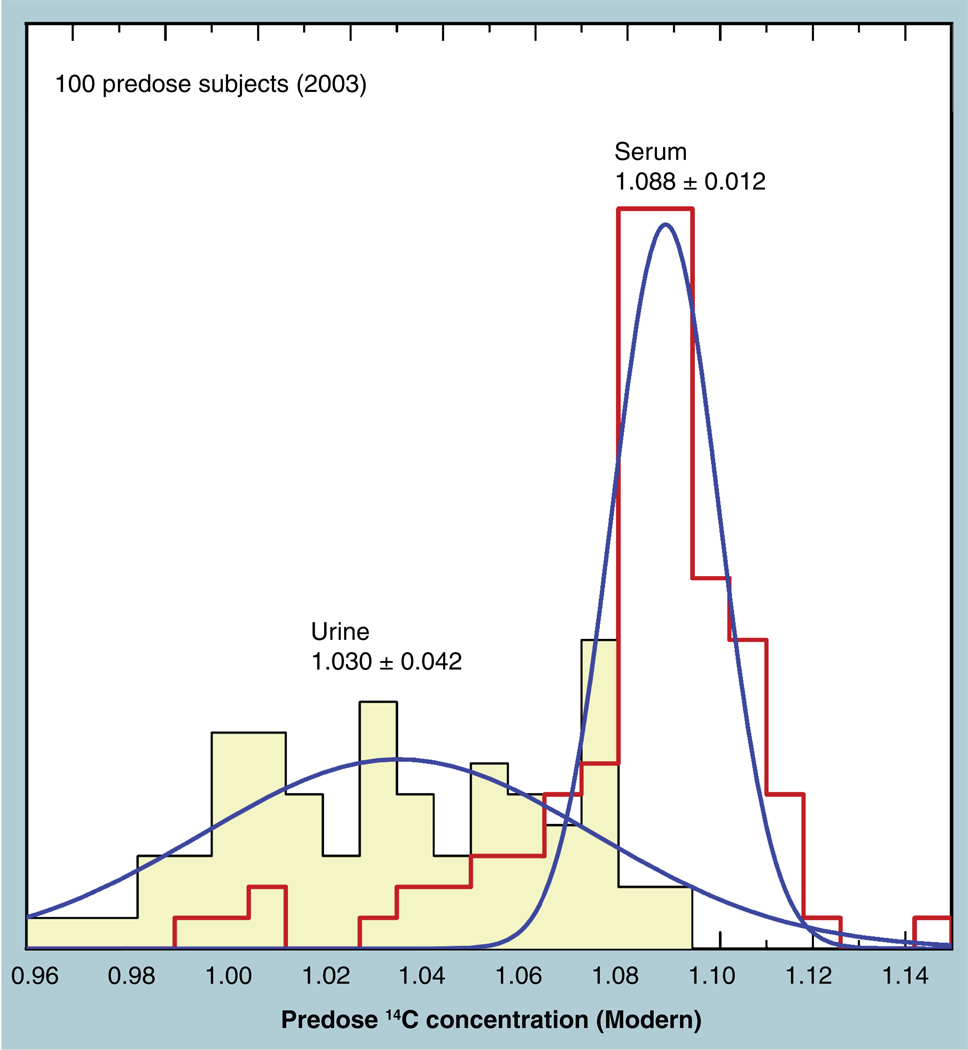
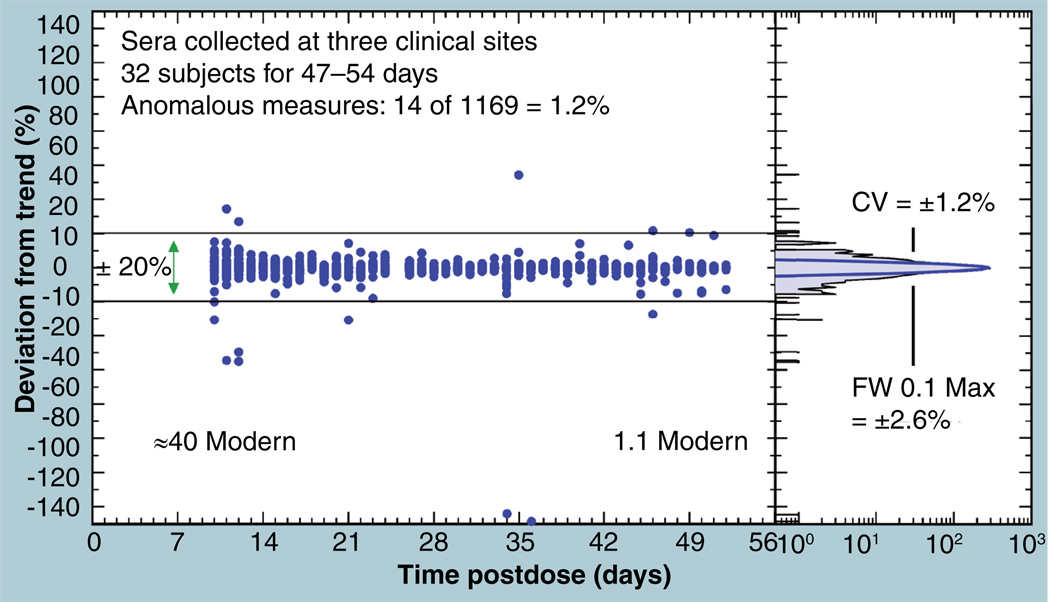
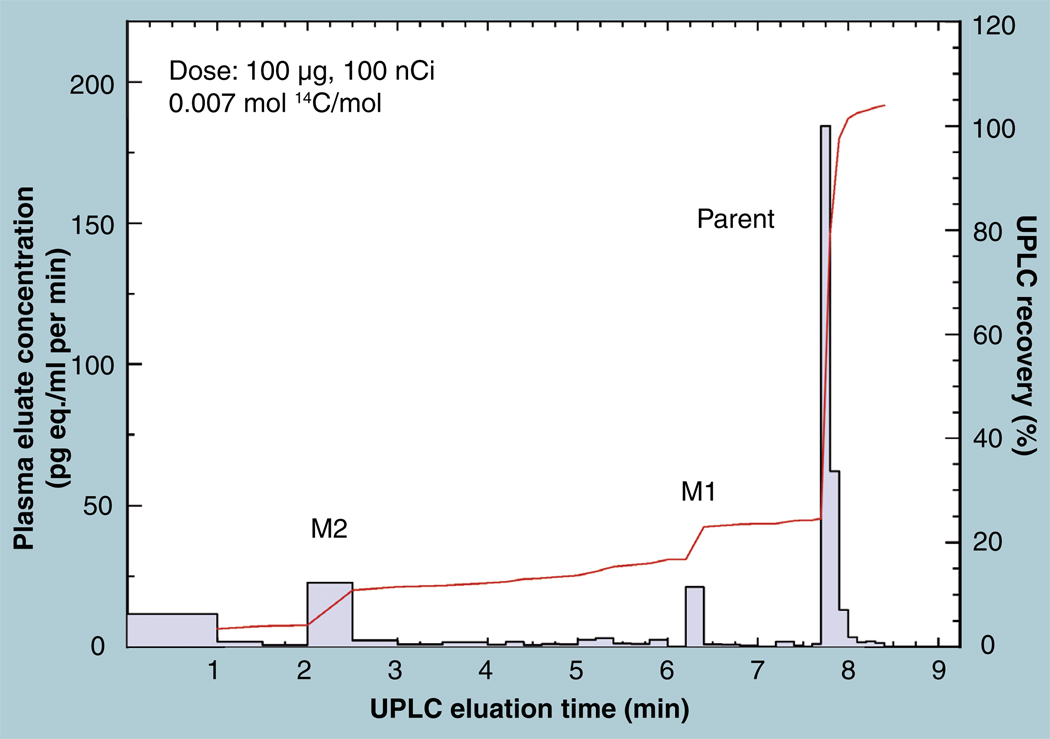
The validation parameters for pharmaceutical analyses were examined for the accelerator mass spectrometry measurement of (14)C/C ratio, independent of chemical separation procedures. The isotope ratio measurement was specific (owing to the (14)C label), stable across samples storage conditions for at least 1 year, linear over four orders of magnitude with an analytical range from 0.1 Modern to at least 2000 Modern (instrument specific). Furthermore, accuracy was excellent (between 1 and 3%), while precision expressed as coefficient of variation was between 1 and 6% determined primarily by radiocarbon content and the time spent analyzing a sample. Sensitivity, expressed as LOD and LLOQ was 1 and 10 attomoles of (14)C, respectively (which can be expressed as compound equivalents) and for a typical small molecule labeled at 10% incorporated with (14)C corresponds to 30 fg equivalents. Accelerator mass spectrometry provides a sensitive, accurate and precise method of measuring drug compounds in biological matrices.
Conflict of interest statement
The authors have no other relevant affiliations or financial involvement with any organization or entity with a financial interest in or financial conflict with the subject matter or materials discussed in the manuscript. This includes employment, consultancies, honoraria, stock ownership or options, expert testimony, grants or patents received or pending, or royalties.
No writing assistance was utilized in the production of this manuscript.
Figures
Similar articles
-
High-throughput liquid chromatography/mass spectrometry method for the quantitation of small molecules using accurate mass technologies in supporting discovery drug screening.Rapid Commun Mass Spectrom. 2013 Feb 15;27(3):401-8. doi: 10.1002/rcm.6461. Rapid Commun Mass Spectrom. 2013. PMID: 23280971
-
Mass spectrometry imaging in drug development.Anal Chem. 2015 Feb 3;87(3):1437-55. doi: 10.1021/ac504734s. Epub 2015 Jan 14. Anal Chem. 2015. PMID: 25526173 Review. No abstract available.
-
Liquid chromatography-mass spectrometry in in vitro drug metabolite screening.Drug Discov Today. 2009 Feb;14(3-4):120-33. doi: 10.1016/j.drudis.2008.11.002. Epub 2008 Dec 26. Drug Discov Today. 2009. PMID: 19059358 Review.
-
High-resolution mass spectrometry will dramatically change our drug-discovery bioanalysis procedures.Bioanalysis. 2011 Jun;3(11):1169-71. doi: 10.4155/bio.11.98. Bioanalysis. 2011. PMID: 21649491 No abstract available.
-
Mass spectrometry imaging for drug distribution studies.J Proteomics. 2012 Aug 30;75(16):4999-5013. doi: 10.1016/j.jprot.2012.07.028. Epub 2012 Jul 25. J Proteomics. 2012. PMID: 22842290 Review.
Cited by
-
Impact of phenanthrene co-administration on the toxicokinetics of benzo[a]pyrene in humans. UPLC-accelerator mass spectrometry following oral microdosing.Chem Biol Interact. 2023 Sep 1;382:110608. doi: 10.1016/j.cbi.2023.110608. Epub 2023 Jun 25. Chem Biol Interact. 2023. PMID: 37369263 Free PMC article.
-
Opportunities in low-level radiocarbon microtracing: applications and new technology.Future Sci OA. 2015 Dec 23;2(1):FSO74. doi: 10.4155/fso.15.74. eCollection 2016 Mar. Future Sci OA. 2015. PMID: 28031933 Free PMC article. Review.
-
Development of a sensitive LC-MS/MS assay to support human microdose study for an oral agonist of the GLP-1 receptor.Bioanalysis. 2024 Jun 2;16(11):545-555. doi: 10.1080/17576180.2024.2349421. Epub 2024 Jun 10. Bioanalysis. 2024. PMID: 39088035 Free PMC article.
-
Benzo[a]pyrene toxicokinetics in humans following dietary supplementation with 3,3'-diindolylmethane (DIM) or Brussels sprouts.Toxicol Appl Pharmacol. 2023 Feb 1;460:116377. doi: 10.1016/j.taap.2023.116377. Epub 2023 Jan 13. Toxicol Appl Pharmacol. 2023. PMID: 36642108 Free PMC article. Clinical Trial.
-
Nanotracing and cavity-ring down spectroscopy: A new ultrasensitive approach in large molecule drug disposition studies.PLoS One. 2018 Oct 17;13(10):e0205435. doi: 10.1371/journal.pone.0205435. eCollection 2018. PLoS One. 2018. PMID: 30332475 Free PMC article.
References
Bibliography
-
- Viswanathan CT, Bansai S, Booth B, et al. Quantitative bioanalytical methods validation and implementation: best practices for chromatographic and ligand binding assays. Pharm. Res. 2007;10:1962–1973. - PubMed
-
- US Pharmacopeia. United States Pharmacopeial Convention, Inc. 1994;23:1982–1984.
-
- ICH International Conference on Harmonisation. Draft guideline on validation of analytical procedures: definitions and terminology. Federal Register. 1995;60:11260.
-
- US FDA. Guideline for submitting samples and analytical data for methods validation. 1987
-
- US FDA. Guidance for industry: Q2B validation of analytical procedures: methodology CDER/CBER. 1996
Websites
-
- GraphPad Software. www.GraphPad.com.
-
- QuantumSoft. www.quansoft.com.
Publication types
MeSH terms
Substances
Grants and funding
LinkOut - more resources
Full Text Sources