

Severe head injury in children: intensive care unit activity and mortality in England and Wales
- PMID: 21083365
- PMCID: PMC3038595
- DOI: 10.3109/02688697.2010.538770
Severe head injury in children: intensive care unit activity and mortality in England and Wales
Abstract
Objective: To explore the relationship between volume of paediatric intensive care unit (PICU) head injury (HI) admissions, specialist paediatric neurosurgical PICU practice, and mortality in England and Wales.
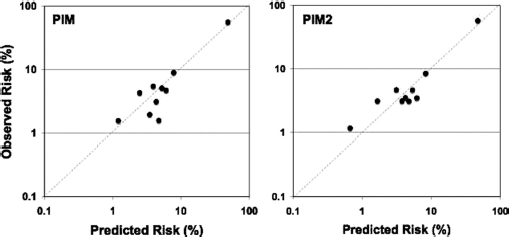
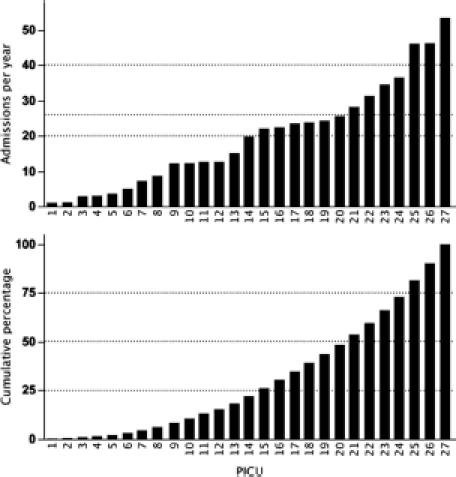
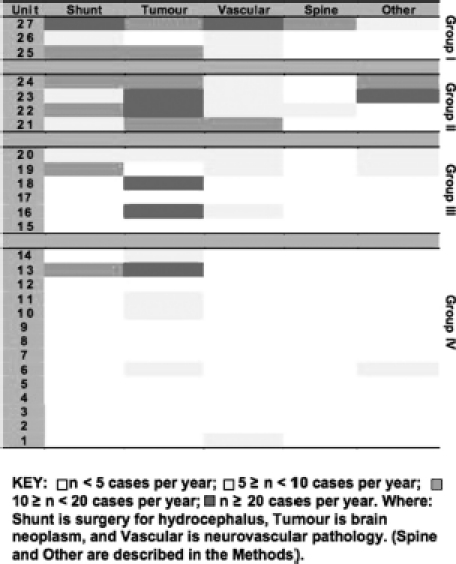
Methods: Analysis of HI cases (age <16 years) from the Paediatric Intensive Care Audit Network national cohort of sequential PICU admissions in 27 units in England and Wales, in the 5 years 2004-2008. Risk-adjusted mortality using the Paediatric Index of Mortality (PIM) model was compared between PICUs aggregated into quartile groups, first to fourth based on descending number of HI admissions/year: highest volume, medium-higher volume, medium-lower volume, and lowest volume. The effect of category of PICU interventions - observation only, mechanical ventilation (MV) only, and intracranial pressure (ICP) monitoring - on outcome was also examined. Observations were reported in relation to specialist paediatric neurosurgical PICU practice.
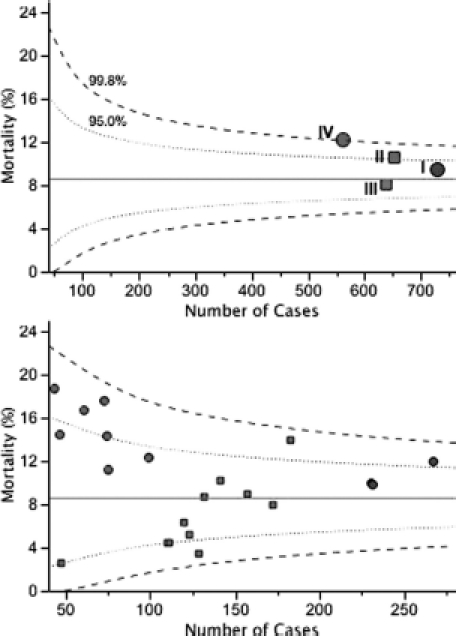
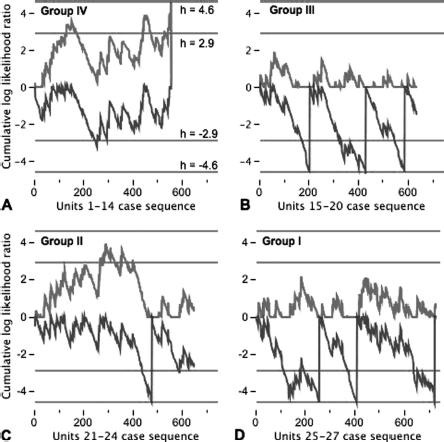
Results: There were 2575 admissions following acute HI (4.4% of non-cardiac surgery PICU admissions in England and Wales). PICU mortality was 9.3%. Units in the fourth-quartile (lowest volume) group did not have significant specialist paediatric neurosurgical activity on the PICU; the other groups did. Overall, there was no effect of HI admissions by individual PICU on risk-adjusted mortality. However, there were significant effects for both intensive care intervention category (p<0.001) and HI admissions by grouping (p<0.005). Funnel plots and control charts using the PIM model showed a hierarchy in increasing performance from lowest volume (group IV), to medium-higher volume (group II), to highest volume (group I), to medium-lower volume (group III) sectors of the health care system.
Conclusions: The health care system in England and Wales for critically ill HI children requiring PICU admission performs as expected in relation to the PIM model. However, the lowest-volume sector, comprising 14 PICUs with little or no paediatric neurosurgical activity on the unit, exhibits worse than expected outcome, particularly in those undergoing ICP monitoring. The best outcomes are seen in units in the mid-volume sector. These data do not support the hypothesis that there is a simple relationship between PICU volume and performance.
Figures
References
-
- The Royal College of Surgeons of England. Report of the working party on the Management of Patients with Head Injuries. London: The Royal College of Surgeons of England; 1999.
-
- The Society of British Neurological Surgeons. Safe neurosurgery 2000. London: Society of British Neurological Surgeons; 1999.
-
- The Royal College of Surgeons of England and the British Orthopaedic Association. Better care for the severely injured. London: Royal College of Surgeons of England; 2000.
Publication types
MeSH terms
LinkOut - more resources
Full Text Sources