

Suicide and unintentional poisoning mortality trends in the United States, 1987-2006: two unrelated phenomena?
- PMID: 21083903
- PMCID: PMC3091585
- DOI: 10.1186/1471-2458-10-705
Suicide and unintentional poisoning mortality trends in the United States, 1987-2006: two unrelated phenomena?
Abstract
Background: Two counter trends in injury mortality have been separately reported in the US in recent times - a declining suicide rate and a rapidly rising unintentional poisoning mortality rate. Poisoning suicides are especially difficult to detect, and injury of undetermined intent is the underlying cause-of-death category most likely to reflect this difficulty. We compare suicide and poisoning mortality trends over two decades in a preliminary assessment of their independence and implications for suicide misclassification.
Methods: Description of overall and gender- and age-specific trends using national mortality data from WISQARS, the Web-based Injury Statistics Query and Reporting System, maintained by the Centers for Disease Control and Prevention (CDC). Subjects were the 936,633 residents dying in the 50 states and the District of Columbia between 1987 and 2006 whose underlying cause of death was classified as suicide, unintentional poisoning, or injury mortality of undetermined intent.
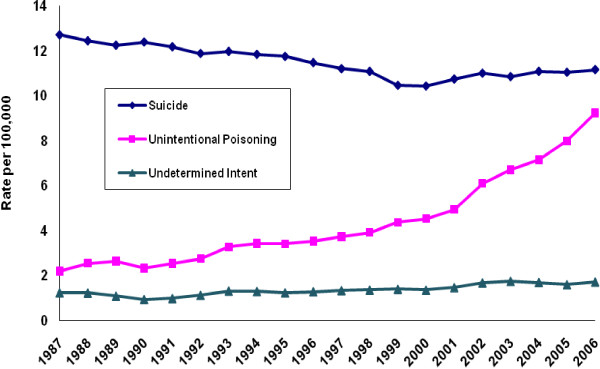
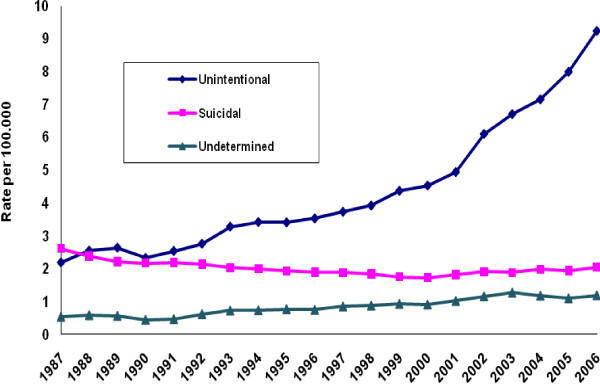
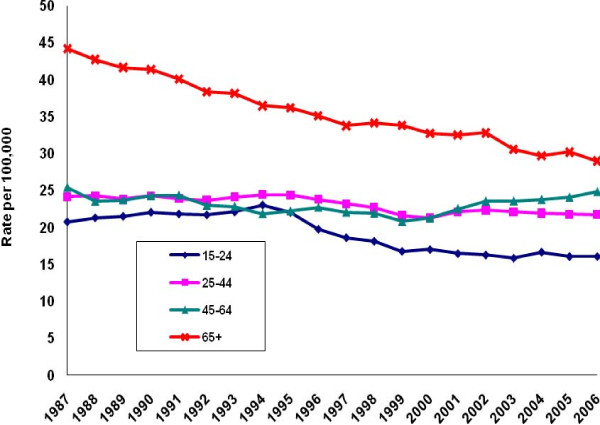
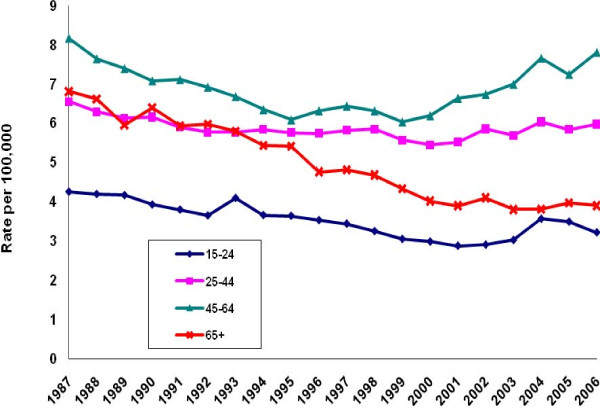
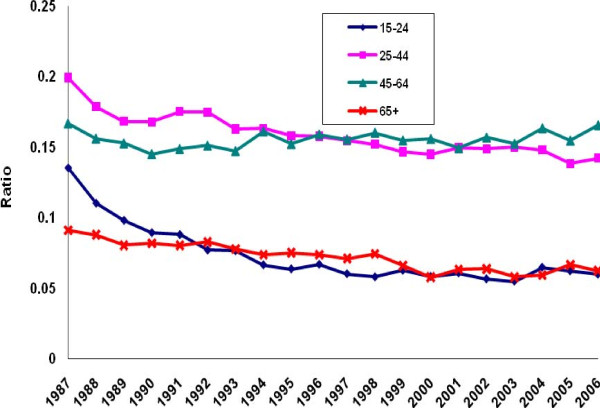
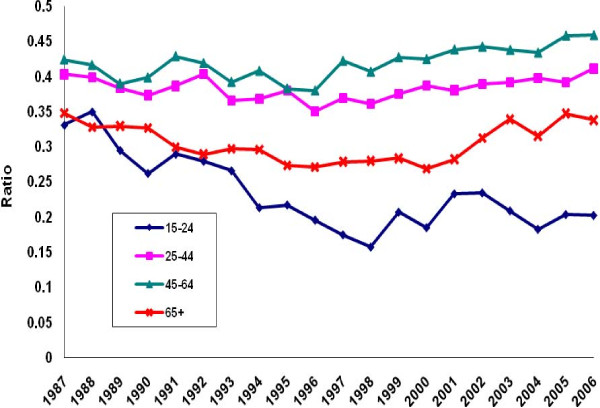
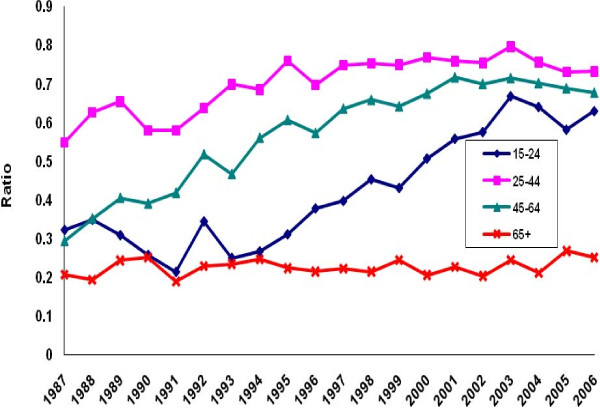
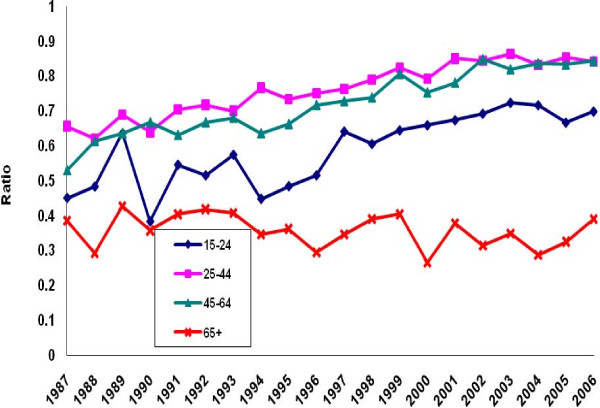
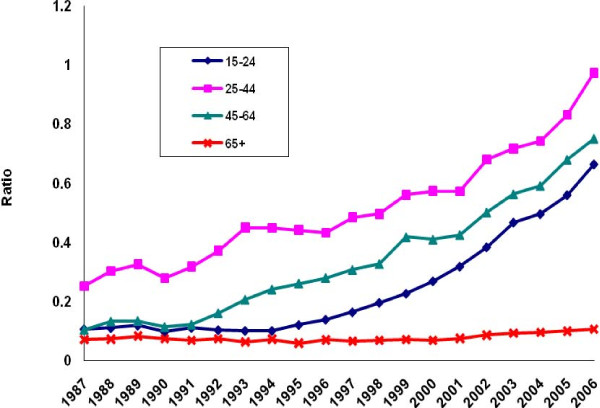
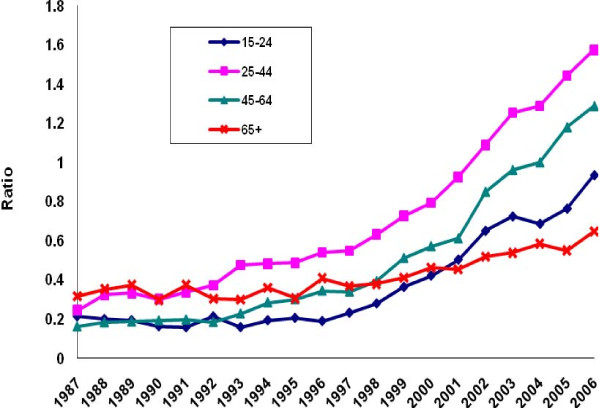
Results: The official US suicide rate declined 18% between 1987 and 2000, from 12.71 to 10.43 deaths per 100,000 population. It then increased to 11.15 deaths per 100,000 by 2006, a 7% rise. By contrast to these much smaller rate changes for suicide, the unintentional poisoning mortality rate rose more than fourfold between 1987 and 2006, from 2.19 to 9.22 deaths per 100,000. Only the population aged 65 years and older showed a sustained decline in the suicide rate over the entire observation period. Consistently highest in gender-age comparisons, the elderly male rate declined by 35%. The elderly female rate declined by 43%. Unlike rate trends for the non-elderly, both declines appeared independent of corresponding mortality trends for unintentional poisoning and poisoning of undetermined intent. The elderly also deviated from younger counterparts by having a smaller proportion of their injury deaths of undetermined intent classified as poisoning. Poisoning manifested as a less common method of suicide for this group than other decedents, except for those aged 15-24 years. Although remaining low, the undetermined poisoning mortality rate increased over the observation period.
Conclusions: The official decline in the suicide rate between 1987 and 2000 may have been a partial artifact of misclassification of non-elderly suicides within unintentional poisoning mortality. We recommend in-depth national, regional, and local population-based research investigations of the poisoning-suicide nexus, and endorse calls for widening the scope of the definition of suicide and evaluation of its risk factors.
Figures
Similar articles
-
Surveillance for Violent Deaths - National Violent Death Reporting System, 42 States, the District of Columbia, and Puerto Rico, 2019.MMWR Surveill Summ. 2022 May 20;71(6):1-40. doi: 10.15585/mmwr.ss7106a1. MMWR Surveill Summ. 2022. PMID: 35588398 Free PMC article.
-
Exploring coronial determination of intent for poisoning-related deaths in Australia, 2001-2013.BMC Public Health. 2017 Aug 1;18(1):83. doi: 10.1186/s12889-017-4633-9. BMC Public Health. 2017. PMID: 28764673 Free PMC article.
-
Poisoning deaths among late-middle aged and older adults: comparison between suicides and deaths of undetermined intent.Int Psychogeriatr. 2019 Aug;31(8):1159-1169. doi: 10.1017/S1041610218001540. Int Psychogeriatr. 2019. PMID: 30353796
-
Suicide in the Philippines: time trend analysis (1974-2005) and literature review.BMC Public Health. 2011 Jul 6;11:536. doi: 10.1186/1471-2458-11-536. BMC Public Health. 2011. PMID: 21733151 Free PMC article. Review.
-
The Recent Rise of Suicide Mortality in the United States.Annu Rev Public Health. 2022 Apr 5;43:99-116. doi: 10.1146/annurev-publhealth-051920-123206. Epub 2021 Oct 27. Annu Rev Public Health. 2022. PMID: 34705474 Free PMC article. Review.
Cited by
-
The Toxicity Potential of Antidepressants and Antipsychotics in Relation to Other Medication and Alcohol: A Naturalistic and Retrospective Study.Front Psychiatry. 2022 May 18;13:825546. doi: 10.3389/fpsyt.2022.825546. eCollection 2022. Front Psychiatry. 2022. PMID: 35669269 Free PMC article.
-
U-shaped association of body mass index in early adulthood with unintentional mortality from injuries: a cohort study of Swedish men with 35 years of follow-up.Int J Obes (Lond). 2016 May;40(5):809-14. doi: 10.1038/ijo.2015.239. Epub 2015 Nov 26. Int J Obes (Lond). 2016. PMID: 26607037
-
Hidden suicides: focus on England and Wales - comparison with other nations.Br J Psychiatry. 2025 Aug;227(2):567-571. doi: 10.1192/bjp.2025.20. Br J Psychiatry. 2025. PMID: 40103556 Free PMC article. Review.
-
Depression, chronic pain, and suicide by overdose: on the edge.Pain Med. 2011 Jun;12 Suppl 2(Suppl 2):S43-8. doi: 10.1111/j.1526-4637.2011.01131.x. Pain Med. 2011. PMID: 21668756 Free PMC article.
-
Variable Classification of Drug-Intoxication Suicides across US States: A Partial Artifact of Forensics?PLoS One. 2015 Aug 21;10(8):e0135296. doi: 10.1371/journal.pone.0135296. eCollection 2015. PLoS One. 2015. PMID: 26295155 Free PMC article.
References
Publication types
MeSH terms
Grants and funding
LinkOut - more resources
Full Text Sources
Medical
