

Physiology of Pseudomonas aeruginosa in biofilms as revealed by transcriptome analysis
- PMID: 21083928
- PMCID: PMC2998477
- DOI: 10.1186/1471-2180-10-294
Physiology of Pseudomonas aeruginosa in biofilms as revealed by transcriptome analysis
Abstract
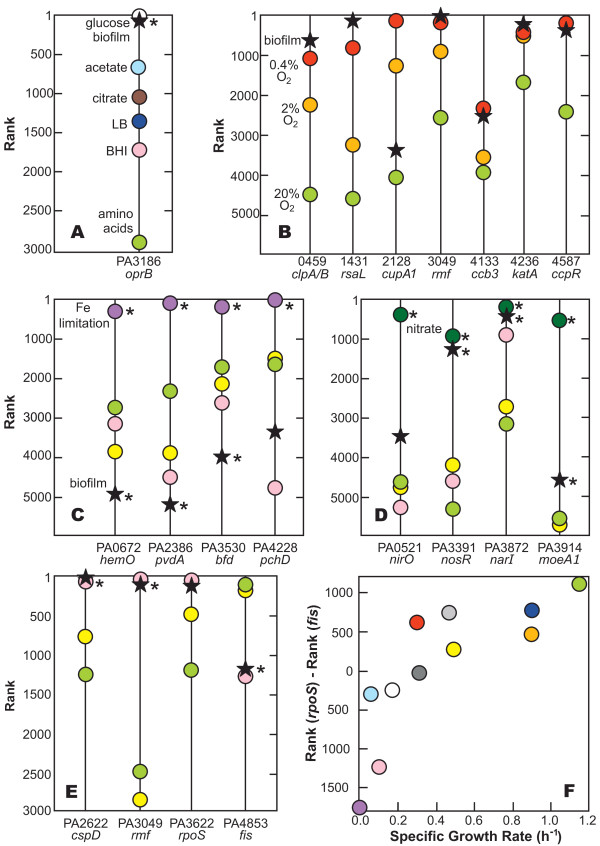
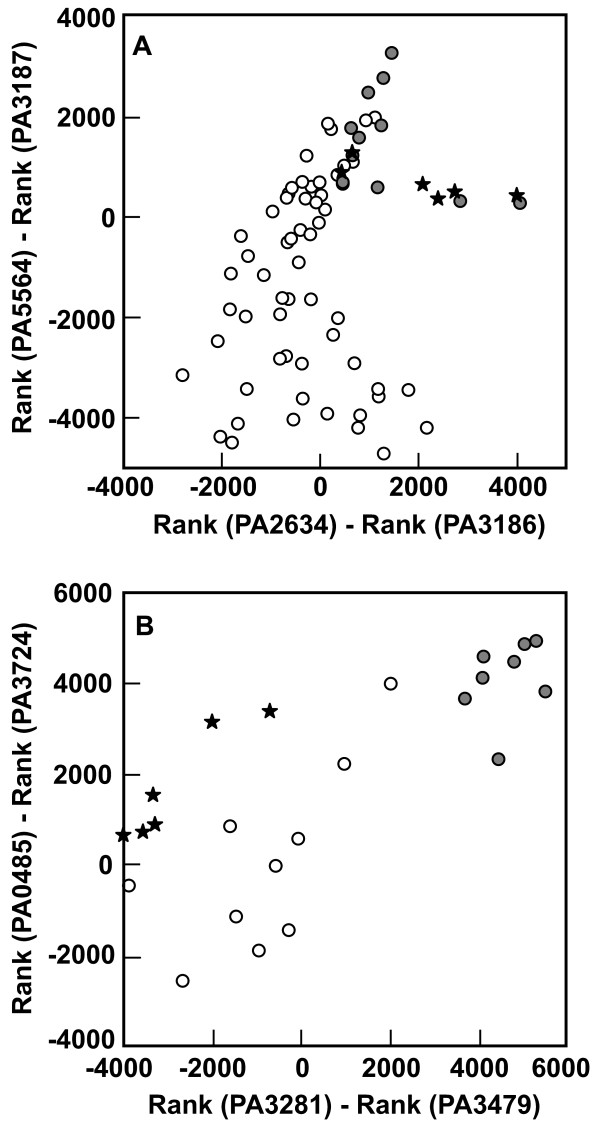
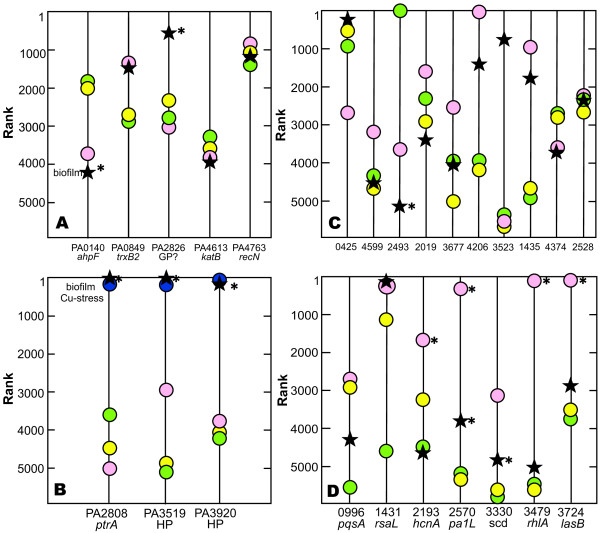
Background: Transcriptome analysis was applied to characterize the physiological activities of Pseudomonas aeruginosa grown for three days in drip-flow biofilm reactors. Conventional applications of transcriptional profiling often compare two paired data sets that differ in a single experimentally controlled variable. In contrast this study obtained the transcriptome of a single biofilm state, ranked transcript signals to make the priorities of the population manifest, and compared rankings for a priori identified physiological marker genes between the biofilm and published data sets.
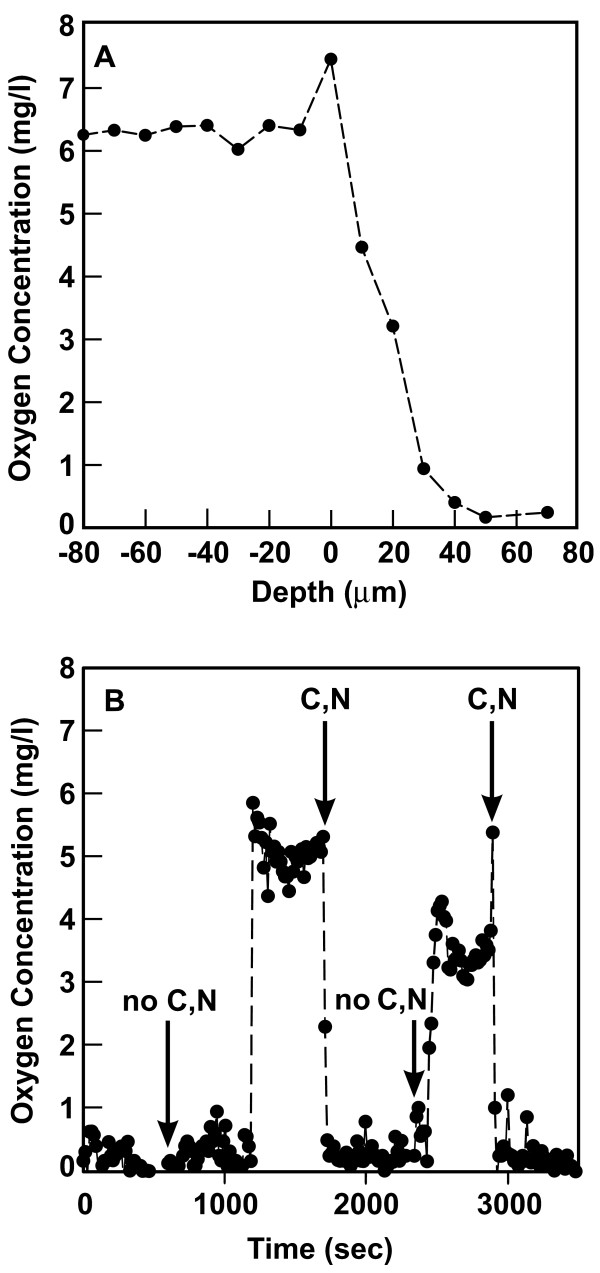
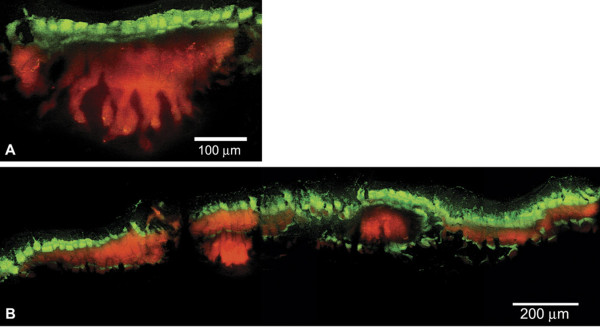
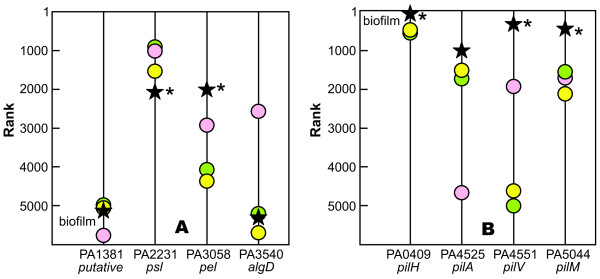
Results: Biofilms tolerated exposure to antibiotics, harbored steep oxygen concentration gradients, and exhibited stratified and heterogeneous spatial patterns of protein synthetic activity. Transcriptional profiling was performed and the signal intensity of each transcript was ranked to gain insight into the physiological state of the biofilm population. Similar rankings were obtained from data sets published in the GEO database http://www.ncbi.nlm.nih.gov/geo. By comparing the rank of genes selected as markers for particular physiological activities between the biofilm and comparator data sets, it was possible to infer qualitative features of the physiological state of the biofilm bacteria. These biofilms appeared, from their transcriptome, to be glucose nourished, iron replete, oxygen limited, and growing slowly or exhibiting stationary phase character. Genes associated with elaboration of type IV pili were strongly expressed in the biofilm. The biofilm population did not indicate oxidative stress, homoserine lactone mediated quorum sensing, or activation of efflux pumps. Using correlations with transcript ranks, the average specific growth rate of biofilm cells was estimated to be 0.08 h(-1).
Conclusions: Collectively these data underscore the oxygen-limited, slow-growing nature of the biofilm population and are consistent with antimicrobial tolerance due to low metabolic activity.
Figures
Similar articles
-
Conceptual Model of Biofilm Antibiotic Tolerance That Integrates Phenomena of Diffusion, Metabolism, Gene Expression, and Physiology.J Bacteriol. 2019 Oct 21;201(22):e00307-19. doi: 10.1128/JB.00307-19. Print 2019 Nov 15. J Bacteriol. 2019. PMID: 31501280 Free PMC article.
-
Contribution of stress responses to antibiotic tolerance in Pseudomonas aeruginosa biofilms.Antimicrob Agents Chemother. 2015 Jul;59(7):3838-47. doi: 10.1128/AAC.00433-15. Epub 2015 Apr 13. Antimicrob Agents Chemother. 2015. PMID: 25870065 Free PMC article.
-
Gene expression in Pseudomonas aeruginosa: evidence of iron override effects on quorum sensing and biofilm-specific gene regulation.J Bacteriol. 2001 Mar;183(6):1990-6. doi: 10.1128/JB.183.6.1990-1996.2001. J Bacteriol. 2001. PMID: 11222597 Free PMC article.
-
Microenvironmental characteristics and physiology of biofilms in chronic infections of CF patients are strongly affected by the host immune response.APMIS. 2017 Apr;125(4):276-288. doi: 10.1111/apm.12668. APMIS. 2017. PMID: 28407427 Review.
-
Recent perspectives on the molecular basis of biofilm formation by Pseudomonas aeruginosa and approaches for treatment and biofilm dispersal.Folia Microbiol (Praha). 2018 Jul;63(4):413-432. doi: 10.1007/s12223-018-0585-4. Epub 2018 Jan 19. Folia Microbiol (Praha). 2018. PMID: 29352409 Review.
Cited by
-
Temperate Bacteriophages-The Powerful Indirect Modulators of Eukaryotic Cells and Immune Functions.Viruses. 2021 May 28;13(6):1013. doi: 10.3390/v13061013. Viruses. 2021. PMID: 34071422 Free PMC article. Review.
-
Wolf in Sheep's Clothing: Clostridioides difficile Biofilm as a Reservoir for Recurrent Infections.Microorganisms. 2021 Sep 10;9(9):1922. doi: 10.3390/microorganisms9091922. Microorganisms. 2021. PMID: 34576818 Free PMC article. Review.
-
Triclosan depletes the membrane potential in Pseudomonas aeruginosa biofilms inhibiting aminoglycoside induced adaptive resistance.PLoS Pathog. 2020 Oct 30;16(10):e1008529. doi: 10.1371/journal.ppat.1008529. eCollection 2020 Oct. PLoS Pathog. 2020. PMID: 33125434 Free PMC article.
-
Search for a Shared Genetic or Biochemical Basis for Biofilm Tolerance to Antibiotics across Bacterial Species.Antimicrob Agents Chemother. 2022 Apr 19;66(4):e0002122. doi: 10.1128/aac.00021-22. Epub 2022 Mar 10. Antimicrob Agents Chemother. 2022. PMID: 35266829 Free PMC article.
-
The biofilm life cycle: expanding the conceptual model of biofilm formation.Nat Rev Microbiol. 2022 Oct;20(10):608-620. doi: 10.1038/s41579-022-00767-0. Epub 2022 Aug 3. Nat Rev Microbiol. 2022. PMID: 35922483 Free PMC article. Review.
References
-
- Hentzer M, Eberl L, Givskov M. Transcriptome analysis of Pseudomonas aeruginosa biofilm development: anaerobic respiration and iron limitation. Biofilms. 2005;2:37–61. doi: 10.1017/S1479050505001699. - DOI
-
- Waite R, Paccanaro A, Papakonstantinopoulou A, Hurst J, Saqi M, Littler E, Curtis M. Clustering of Pseudomonas aeruginosa transcriptomes from planktonic cultures, developing and mature biofilms reveals distinct expression profiles. BMC Genomics. 2006;7:162. doi: 10.1186/1471-2164-7-162. - DOI - PMC - PubMed
Publication types
MeSH terms
Substances
Grants and funding
LinkOut - more resources
Full Text Sources
Other Literature Sources
Molecular Biology Databases
