. 2011 Feb;119(2):210-8.
doi: 10.1289/ehp.1002313. Epub 2010 Oct 7.

Heat waves in the United States: mortality risk during heat waves and effect modification by heat wave characteristics in 43 U.S. communities

Affiliations

Heat waves in the United States: mortality risk during heat waves and effect modification by heat wave characteristics in 43 U.S. communities

G Brooke Anderson et al. Environ Health Perspect. 2011 Feb.

Abstract

Background: Devastating health effects from recent heat waves, and projected increases in frequency, duration, and severity of heat waves from climate change, highlight the importance of understanding health consequences of heat waves.

Objectives: We analyzed mortality risk for heat waves in 43 U.S. cities (1987-2005) and investigated how effects relate to heat waves' intensity, duration, or timing in season.

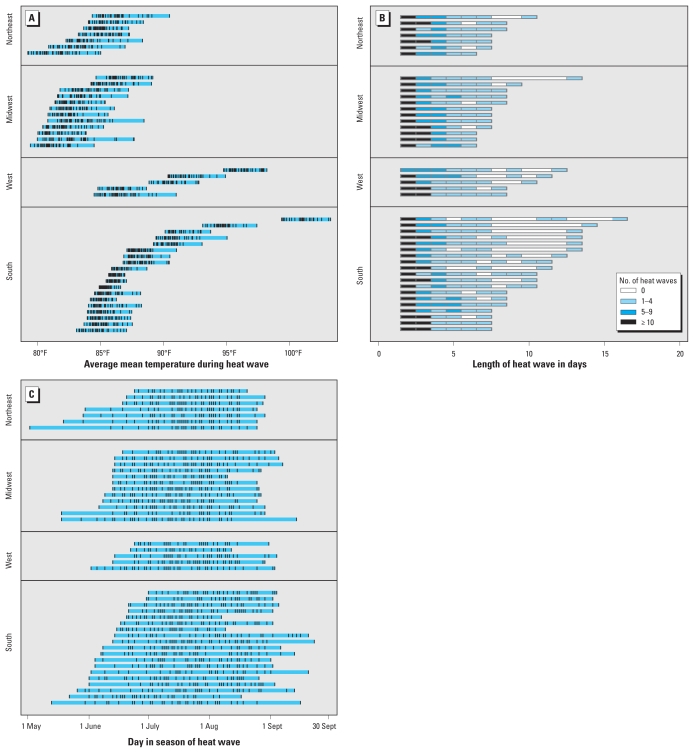
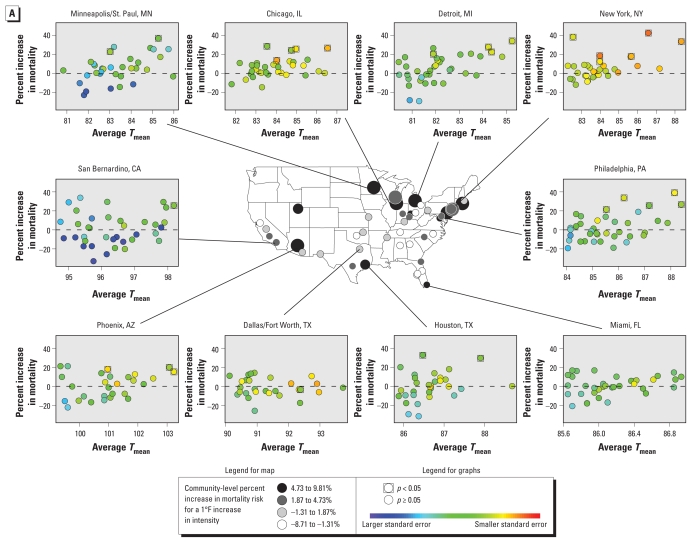
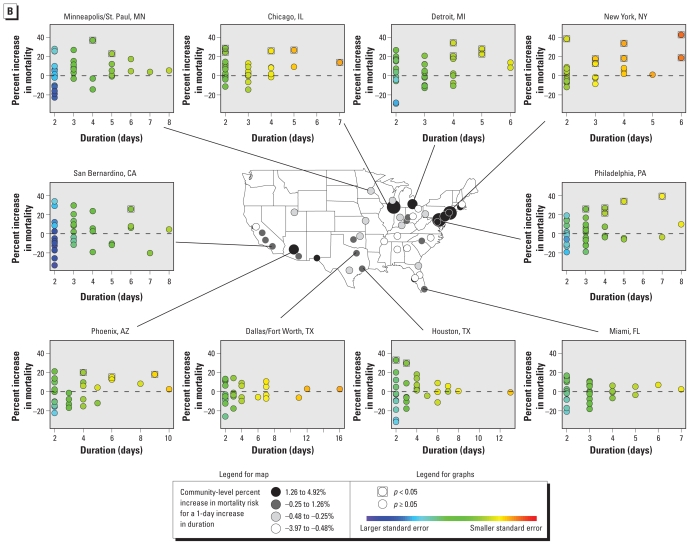
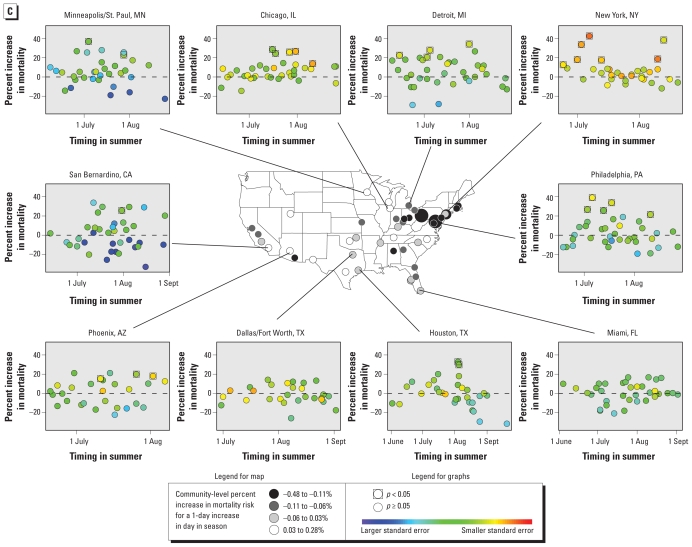
Methods: Heat waves were defined as ≥ 2 days with temperature ≥ 95th percentile for the community for 1 May through 30 September. Heat waves were characterized by their intensity, duration, and timing in season. Within each community, we estimated mortality risk during each heat wave compared with non-heat wave days, controlling for potential confounders. We combined individual heat wave effect estimates using Bayesian hierarchical modeling to generate overall effects at the community, regional, and national levels. We estimated how heat wave mortality effects were modified by heat wave characteristics (intensity, duration, timing in season).

Results: Nationally, mortality increased 3.74% [95% posterior interval (PI), 2.29-5.22%] during heat waves compared with non-heat wave days. Heat wave mortality risk increased 2.49% for every 1°F increase in heat wave intensity and 0.38% for every 1-day increase in heat wave duration. Mortality increased 5.04% (95% PI, 3.06-7.06%) during the first heat wave of the summer versus 2.65% (95% PI, 1.14-4.18%) during later heat waves, compared with non-heat wave days. Heat wave mortality impacts and effect modification by heat wave characteristics were more pronounced in the Northeast and Midwest compared with the South.

Conclusions: We found higher mortality risk from heat waves that were more intense or longer, or those occurring earlier in summer. These findings have implications for decision makers and researchers estimating health effects from climate change.


Figures

Figure 1
Figure 1
Heat wave characteristics in 43 individual communities (1987–2005). Each horizontal line represents one community, and the length of each line indicates the range of each heat wave characteristic in that community. (A) Intensity of each individual heat wave within a community (tick marks within blue bars). (B) Number of heat waves according to duration (shading) by community. By definition, all heat waves lasted ≥ 2 days. (C) Heat wave timing in season by community (tick marks, individual heat waves).
Figure 2
Figure 2
Heat wave characteristics and heat wave effects in 43 communities (1987–2005): associations between heat wave effects (percent mortality increase during the heat wave vs. non-heat wave days) and average Tmean during each heat wave (A), heat wave duration (B), and timing in season of the heat wave (C). Maps show relative risks of nonaccidental mortality during heat wave days compared with non-heat wave days (controlling for daily temperature) and heat wave characteristics. On the map, the color of each community’s circle reflects the magnitude of effect modification; the size reflects the statistical variance, with larger circles indicating more precise estimates. Graph insets plot the value of each heat wave characteristic versus its nonaccidental mortality effect [estimated as an added heat wave effect (Hajat et al. 2006)] for the 10 most populous communities. For these graphs, each circle represents an individual heat wave, and the circle’s color reflects the variance of the mortality effect. The July 1995 Chicago heat wave and August 1988 Minneapolis/St. Paul heat wave are omitted as they are outside the range of the figures. Scales on x-axes differ among the graphs for individual cities.
Figure 2
Figure 2
Heat wave characteristics and heat wave effects in 43 communities (1987–2005): associations between heat wave effects (percent mortality increase during the heat wave vs. non-heat wave days) and average Tmean during each heat wave (A), heat wave duration (B), and timing in season of the heat wave (C). Maps show relative risks of nonaccidental mortality during heat wave days compared with non-heat wave days (controlling for daily temperature) and heat wave characteristics. On the map, the color of each community’s circle reflects the magnitude of effect modification; the size reflects the statistical variance, with larger circles indicating more precise estimates. Graph insets plot the value of each heat wave characteristic versus its nonaccidental mortality effect [estimated as an added heat wave effect (Hajat et al. 2006)] for the 10 most populous communities. For these graphs, each circle represents an individual heat wave, and the circle’s color reflects the variance of the mortality effect. The July 1995 Chicago heat wave and August 1988 Minneapolis/St. Paul heat wave are omitted as they are outside the range of the figures. Scales on x-axes differ among the graphs for individual cities.

Comment in

References

    1. Anderson BG, Bell ML. Weather-related mortality: how heat, cold, and heat waves affect mortality in the United States. Epidemiology. 2009;20(2):205–213. - PMC - PubMed
    1. Baccini M, Biggeri A, Accetta G, Kosatsky T, Katsouyanni K, Analitis A, et al. Heat effects on mortality in 15 European cities. Epidemiology. 2008;19(5):711–719. - PubMed
    1. Barnett AG. Temperature and cardiovascular deaths in the US elderly: changes over time. Epidemiology. 2007;18(3):369–372. - PubMed
    1. Bell ML, Dominici F. Effect modification by community characteristics on the short-term effects of ozone exposure and mortality in 98 US communities. Am J Epidemiol. 2008;167(8):986–997. - PMC - PubMed
    1. Bell ML, McDermott A, Zeger SL, Samet JM, Dominici F. Ozone and short-term mortality in 95 US urban communities, 1987–2000. JAMA. 2004;292(19):2372–2378. - PMC - PubMed

Publication types