HES1 (hairy and enhancer of split 1) is a determinant of bone mass
- PMID: 21084301
- PMCID: PMC3024760
- DOI: 10.1074/jbc.M110.183038
HES1 (hairy and enhancer of split 1) is a determinant of bone mass
Abstract
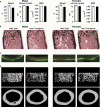
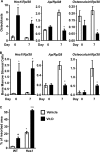
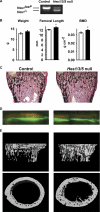
HES1 (hairy and enhancer of split) is a transcription factor that regulates osteoblastogenesis in vitro. The skeletal effects of HES1 misexpression were studied. Transgenic mice where a 3.6-kilobase fragment of the collagen type 1 α1 promoter directs HES1 overexpression were created. Transgenics were osteopenic due to decreased osteoblast function in female and increased bone resorption in male mice. HES1 impaired osteoblastogenesis in vitro, and transgenic osteoblasts enhanced the resorptive activity of co-cultured osteoclast precursors. Mice homozygous for a Hes1 loxP-targeted allele were bred to transgenics, where the paired-related homeobox gene enhancer or the osteocalcin promoter direct Cre recombinase expression to inactivate Hes1 in the limb bud or in osteoblasts. To avoid genetic compensation, Hes1 was inactivated in the context of the global deletion of Hes3 and Hes5. Hes3 and Hes5 null mice had no skeletal phenotype. Hes1 inactivation in the limb bud increased femoral length and trabecular number. Hes1 inactivation in osteoblasts increased trabecular bone volume, number, and connectivity due to increased mineral apposition rate and suppressed bone resorption. Hes1 inactivation in vitro increased alkaline phosphatase expression and suppressed the resorptive activity of co-cultured osteoclast precursors. In conclusion, by inhibiting osteoblast function and inducing bone resorption, HES1 is an intracellular determinant of bone mass and structure.
Figures


Similar articles
-
Hairy and Enhancer of Split-related with YRPW motif (HEY)2 regulates bone remodeling in mice.J Biol Chem. 2013 Jul 26;288(30):21547-57. doi: 10.1074/jbc.M113.489435. Epub 2013 Jun 19. J Biol Chem. 2013. PMID: 23782701 Free PMC article.
-
Misexpression of CCAAT/enhancer binding protein beta causes osteopenia.J Endocrinol. 2009 May;201(2):263-74. doi: 10.1677/JOE-08-0514. Epub 2009 Feb 13. J Endocrinol. 2009. PMID: 19218285 Free PMC article.
-
Notch inhibits osteoblast differentiation and causes osteopenia.Endocrinology. 2008 Aug;149(8):3890-9. doi: 10.1210/en.2008-0140. Epub 2008 Apr 17. Endocrinology. 2008. PMID: 18420737 Free PMC article.
-
Expression dynamics and functions of Hes factors in development and diseases.Curr Top Dev Biol. 2014;110:263-83. doi: 10.1016/B978-0-12-405943-6.00007-5. Curr Top Dev Biol. 2014. PMID: 25248479 Review.
-
Hijacking HES1: how tumors co-opt the anti-differentiation strategies of quiescent cells.Trends Mol Med. 2010 Jan;16(1):17-26. doi: 10.1016/j.molmed.2009.11.001. Epub 2009 Dec 18. Trends Mol Med. 2010. PMID: 20022559 Free PMC article. Review.
Cited by
-
HES factors regulate specific aspects of chondrogenesis and chondrocyte hypertrophy during cartilage development.J Cell Sci. 2016 Jun 1;129(11):2145-55. doi: 10.1242/jcs.181271. Epub 2016 May 9. J Cell Sci. 2016. PMID: 27160681 Free PMC article.
-
Canonical Notch activation in osteocytes causes osteopetrosis.Am J Physiol Endocrinol Metab. 2016 Jan 15;310(2):E171-82. doi: 10.1152/ajpendo.00395.2015. Epub 2015 Nov 17. Am J Physiol Endocrinol Metab. 2016. PMID: 26578715 Free PMC article.
-
A Multifaceted Giant Protein Microtubule-Actin Cross-Linking Factor 1.Int J Mol Sci. 2025 Mar 30;26(7):3204. doi: 10.3390/ijms26073204. Int J Mol Sci. 2025. PMID: 40244019 Free PMC article. Review.
-
Notch regulation of bone development and remodeling and related skeletal disorders.Calcif Tissue Int. 2012 Feb;90(2):69-75. doi: 10.1007/s00223-011-9541-x. Epub 2011 Oct 16. Calcif Tissue Int. 2012. PMID: 22002679 Free PMC article. Review.
-
Notch1 and Notch2 expression in osteoblast precursors regulates femoral microarchitecture.Bone. 2014 May;62:22-8. doi: 10.1016/j.bone.2014.01.023. Epub 2014 Feb 4. Bone. 2014. PMID: 24508387 Free PMC article.
References
Publication types
MeSH terms
Substances
Grants and funding
LinkOut - more resources
Full Text Sources
Medical
Molecular Biology Databases
Research Materials

