. 2011 Jan 21;286(3):2088-100.
doi: 10.1074/jbc.M110.153551. Epub 2010 Nov 17.

Characterization of a binding site for anionic phospholipids on KCNQ1

Affiliations

Characterization of a binding site for anionic phospholipids on KCNQ1

Alison M Thomas et al. J Biol Chem. .

Abstract

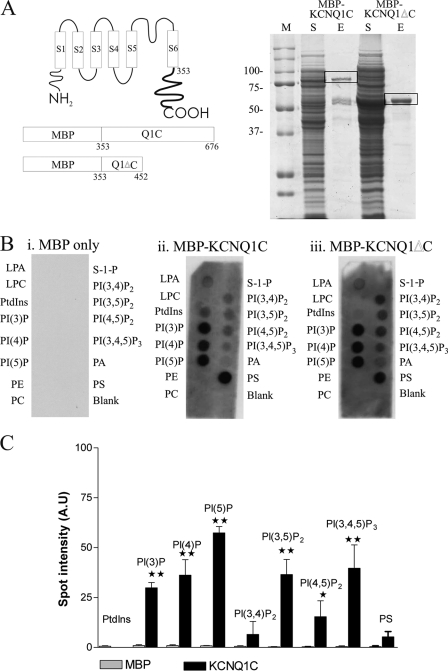
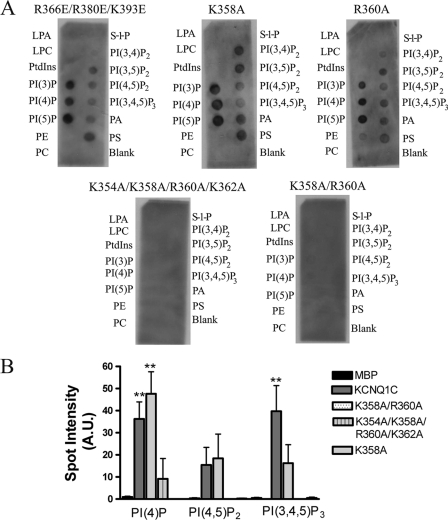
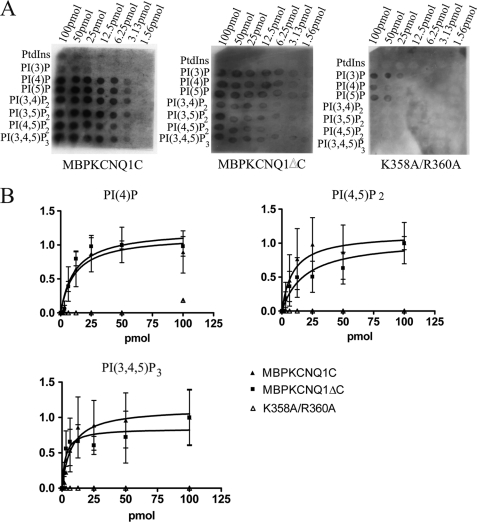
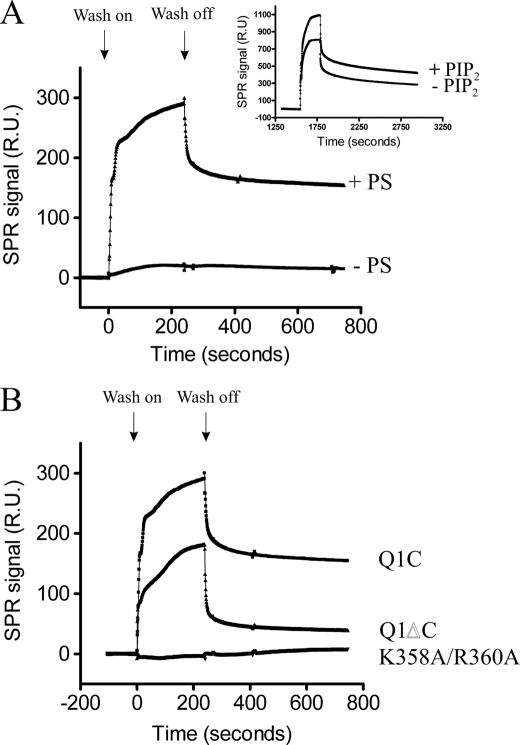
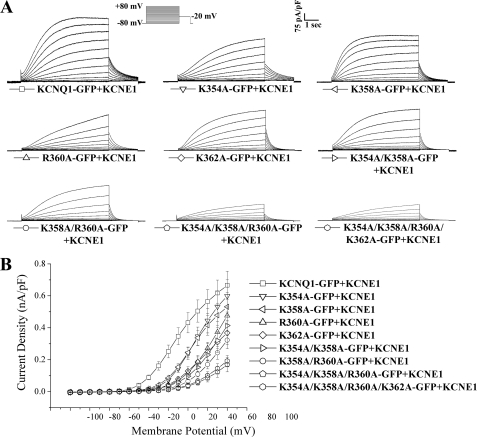
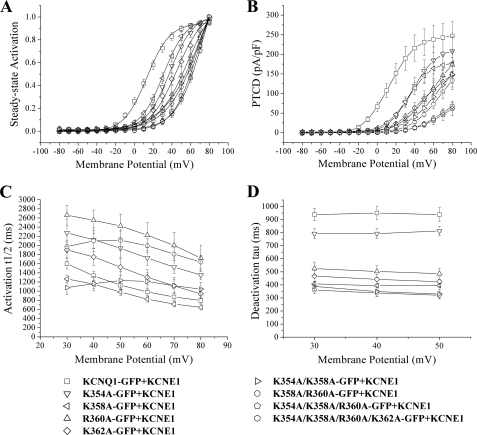
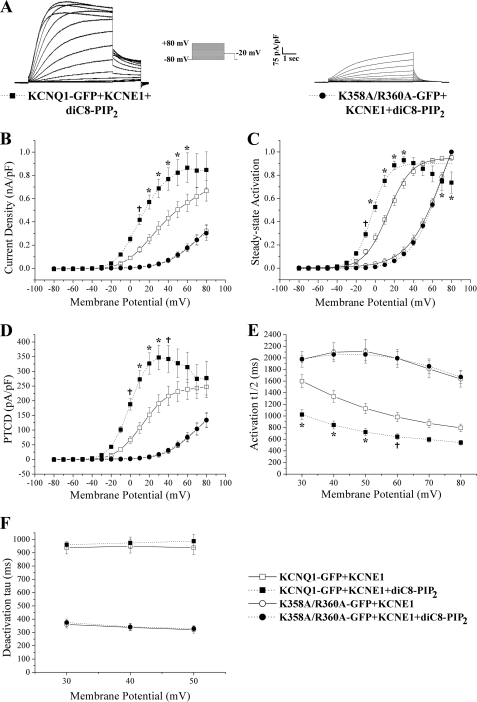
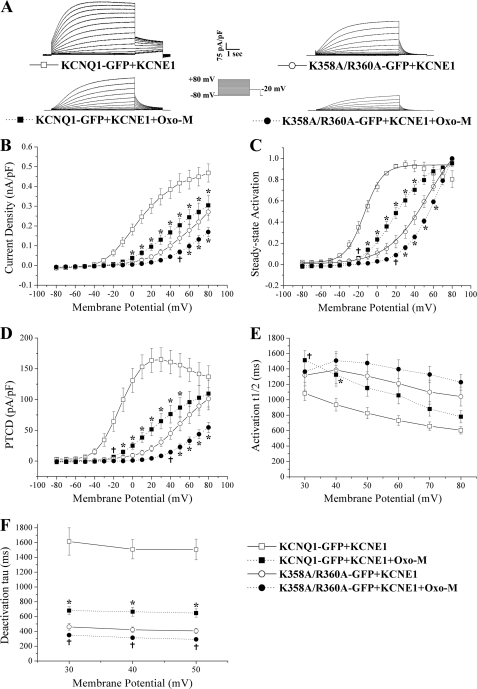
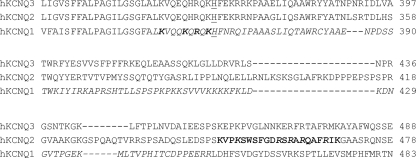
The KCNQ family of potassium channels underlie a repolarizing K(+) current in the heart and the M-current in neurones. The assembly of KCNQ1 with KCNE1 generates the delayed rectifier current I(Ks) in the heart. Characteristically these channels are regulated via G(q/11)-coupled receptors and the inhibition seen after phospholipase C activation is now thought to occur from membrane phosphatidylinositol (4,5)-bisphosphate (PIP(2)) depletion. It is not clear how KCNQ1 recognizes PIP(2) and specifically which residues in the channel complex are important. Using biochemical techniques we identify a cluster of basic residues namely, Lys-354, Lys-358, Arg-360, and Lys-362, in the proximal C terminus as being involved in binding anionic phospholipids. The mutation of specific residues in combination, to alanine leads to the loss of binding to phosphoinositides. Functionally, the introduction of these mutations into KCNQ1 leads to shifts in the voltage dependence of channel activation toward depolarized potentials and reductions in current density. Additionally, the biophysical effects of the charge neutralizing mutations, which disrupt phosphoinositide binding, mirror the effects we see on channel function when we deplete cellular PIP(2) levels through activation of a G(q/11)-coupled receptor. Conversely, the addition of diC8-PIP(2) to the wild-type channel, but not a PIP(2) binding-deficient mutant, acts to shift the voltage dependence of channel activation toward hyperpolarized potentials and increase current density. In conclusion, we use a combined biochemical and functional approach to identify a cluster of basic residues important for the binding and action of anionic phospholipids on the KCNQ1/KCNE1 complex.


Figures

FIGURE 1.
FIGURE 1.
Purification and lipid binding of MBP, MBPKCNQ1C, and MBPKCNQ1ΔC. A, schematic diagram showing the topology of the KCNQ1 channel. The proposed amino acid at the start of the C-terminal domain is indicated. The constructs used and the amino acids of KCNQ1 used to create them are also shown. A 10% SDS-PAGE gel was run with the soluble fraction from the purification (S) and 2 μg of eluted protein (E) for both MBPKCNQ1C (79 kDa) and MBPKCNQ1ΔC proteins (50 kDa). The Bio-Rad broad range prestained marker is shown and the marker sizes in kilodaltons are indicated. B, PIP strips that have been incubated overnight with 1 μg/ml of the desired protein as indicated and binding detected using an anti-MBP antiserum (1:1000) followed by anti-rabbit antibody (1:5000) from the ECL kit (GE Healthcare). (i) indicates binding observed with MBP, whereas (ii) and (iii) are MBPKCNQ1C and MBPKCNQ1ΔC, respectively. C, the relative binding of MBPKCNQ1C in comparison to MBP for a selection of the phosphoinositols present. MBPKCNQ1C has a broad specificity of binding. **, p < 0.01 and *, p < 0.05 as determined using one-way ANOVA followed by Dunnett's post test (n = 3). Data are presented as mean ± S.E.
FIGURE 2.
FIGURE 2.
Lipid binding of MBPKCNQ1C mutant proteins. A, a representative PIP strip for representative mutants as indicated. B, the relative spot intensities for PI(4)P, PI(4,5)P2, and PI(3,4,5)P3 for a variety of the mutants in comparison to the full-length MBPKCNQ1C and MBP. Statistical significance between MBP and MBPKCNQ1C mutants for different phosphoinositols is indicated as ** p < 0.01, determined using one-way ANOVA followed by Dunnett's post test (n = 3). Data are presented as mean ± S.E.
FIGURE 3.
FIGURE 3.
PIP arrays of MBPKCNQ1C, MBPKCNQ1ΔC and MBPKCNQ1C K358A/R360A. A, shows representative PIP arrays for MBPKCNQ1C, MBPKCNQ1ΔC, and MBPKCNQ1C K358A/R360A. Spot intensities are from left to right, 100, 50, 25, 12.5, 6.25, 3.13, and 1.56 pmol. B, shows plots of mean spot intensity versus lipid concentration for MBPKCNQ1C (filled triangle), MBPKCNQ1ΔC (filled square), and MBPKCNQ1C K358A/R360A (open triangle) for (i) PI(4)P, (ii) PI(4,5)P2, and (iii) PI(3,4,5)P3. All values were normalized and n = 3. Data are presented as mean ± S.E.
FIGURE 4.
FIGURE 4.
Surface plasmon resonance experiments. A, shows a representative trace for binding of 1 μm MBPKCNQ1C to liposomes containing either PC/PE/PS/PIP2 or PC/PE/PIP2. The traces show the subtraction of the flow cell containing PIP2 minus the flow cell without PIP2 (inset in the figure are the raw traces that are subtracted). The presence of PS is required for binding of MBPKCNQ1C. B, this shows a representative trace of 1 μm of each MBPKCNQ1C, MBPKCNQ1ΔC, and MBPKCNQ1C K358A/R360A. These were repeated 3 times giving similar results each time. No binding is observed with MBPKCNQ1C K358A/R360A.
FIGURE 5.
FIGURE 5.
The electrophysiological characterization of the effect of charge neutralizing mutations in a region involved in phosphoinositide binding on KCNQ1-GFP. A, representative whole cell recordings of KCNQ1-GFP and mutants as indicated co-expressed with KCNE1. Currents were normalized to cell capacitance. The voltage protocol used is shown in the inset. B, mean current-voltage relationships. Current-voltage relationships were determined by normalizing the maximal current densities at the end of each pulse potential to cell capacitance (nA/pF). Data are presented as mean ± S.E. The number of cells analyzed are indicated in Table 1.
FIGURE 6.
FIGURE 6.
Detailed examination of the electrophysiological properties of the currents generated by charge neutralizing mutations in a region involved in phosphoinositide binding on KCNQ1-GFP. A, normalized voltage-dependent activation (steady-state activation) curves. The steady-state activation curves were determined by fitting the normalized amplitude of the peak tail currents versus test potential with a Boltzmann function (solid lines). B, PTCD was determined by normalizing the maximal peak tail current densities in response to each pulse potential to cell capacitance (pA/pF). C and D, activation and deactivation kinetics with voltage. The rates of activation (activation t½) and deactivation (deactivation τ) were determined as described under “Experimental Procedures.” Data are presented as mean ± S.E. The number of cells analyzed are indicated in Table 1.
FIGURE 7.
FIGURE 7.
The electrophysiological effects of the intracellular addition of diC8-PIP2 on the wild-type channel and a PIP binding site mutant. A, representative whole cell recordings of KCNQ1-GFP and mutants as indicated co-expressed with KCNE1 in the presence of 25 μm diC8-PIP2. Currents were normalized to cell capacitance. The voltage protocol used is shown in the inset. B, mean current-voltage relationships. Current-voltage relationships were determined by normalizing the maximal current densities at the end of each pulse potential to cell capacitance (nA/pF). C, normalized voltage-dependent activation (steady-state activation) curves. The steady-state activation curves were determined by fitting the normalized amplitude of the peak tail currents versus test potential with a Boltzmann function (solid or dashed lines). D, PTCD was determined by normalizing the maximal peak tail current in response to each pulse potential to cell capacitance (pA/pF). E and F, activation and deactivation kinetics with voltage. The rates of activation (activation t½) and deactivation (deactivation τ) were determined as described under “Experimental Procedures.” Data are presented as mean ± S.E. The number of cells analyzed are indicated in Table 1. For statistical comparison between diC8-PIP2 (25 μm) treated and untreated groups (e.g. KCNQ1-GFP/KCNE1 ± diC8-PIP2), a two-way ANOVA with a Bonferroni post hoc test was performed. †, p < 0.05 diC8-PIP2-treated (25 μm) group compared with untreated group. *, p < 0.01 diC8-PIP2-treated (25 μm) group compared with untreated group.
FIGURE 8.
FIGURE 8.
Effects of muscarinic 1 receptor (hM1) activation on the currents generated by the wild-type channel and a PIP2 binding site mutant. Currents were recorded in a CHO cell line stably expressing the human muscarinic 1 receptor (CHO-hM1). After the whole cell configuration was achieved 10 μm Oxo-M was either applied or not in the extracellular solution using a gravity based perfusion system for 5 min before and throughout recording. A, representative whole cell recordings of KCNQ1-GFP and K358A/R360A-GFP as indicated co-expressed with KCNE1 in the presence or absence of 10 μm Oxo-M. Currents were normalized to cell capacitance. The voltage protocol used is shown in the inset. B, mean current-voltage relationships. Current-voltage relationships were determined by normalizing the maximal current densities at the end of each pulse potential to cell capacitance (nA/pF). C, normalized voltage-dependent activation (steady-state activation) curves. The steady-state activation curves were determined by fitting the normalized amplitude of the peak tail currents versus test potential with a Boltzmann function (solid or dashed lines). D, PTCD was determined by normalizing the maximal peak tail current in response to each pulse potential to cell capacitance (pA/pF). E and F, activation and deactivation kinetics with voltage. The rates of activation (activation t½) and deactivation (deactivation τ) were determined as described under “Experimental Procedures.” Data are presented as mean ± S.E. The number of cells analyzed are indicated in Table 1. For statistical comparison between Oxo-M-treated (10 μm) and untreated groups (e.g. KCNQ1-GFP/KCNE1 ± Oxo-M), a two-way ANOVA with a Bonferroni post hoc test was performed. †, p < 0.05 Oxo-M-treated (10 μm) group compared with untreated group. *, p < 0.01 Oxo-M-treated (10 μm) group compared with untreated group.
FIGURE 9.
FIGURE 9.
Alignment of human KCNQ1, KCNQ2, and KCNQ3. The highlighted residues in bold in KCNQ1 are those studied in this article. Histidine 361 is underlined and the region identified by Shapiro and colleagues (46, 47) in KCNQ2 is also highlighted. The extent of the deletion mutation in KCNQ1 is indicated by italics.

Similar articles

Cited by

References

    1. Sanguinetti M. C., Jurkiewicz N. K. (1990) J. Gen. Physiol. 96, 195–215 - PMC - PubMed
    1. Barhanin J., Lesage F., Guillemare E., Fink M., Lazdunski M., Romey G. (1996) Nature 384, 78–80 - PubMed
    1. Sanguinetti M. C., Curran M. E., Zou A., Shen J., Spector P. S., Atkinson D. L., Keating M. T. (1996) Nature 384, 80–83 - PubMed
    1. Moss A. J., Kass R. S. (2005) J. Clin. Invest. 115, 2018–2024 - PMC - PubMed
    1. Nerbonne J. M., Kass R. S. (2005) Physiol. Rev. 85, 1205–1253 - PubMed

Publication types

MeSH terms

LinkOut - more resources